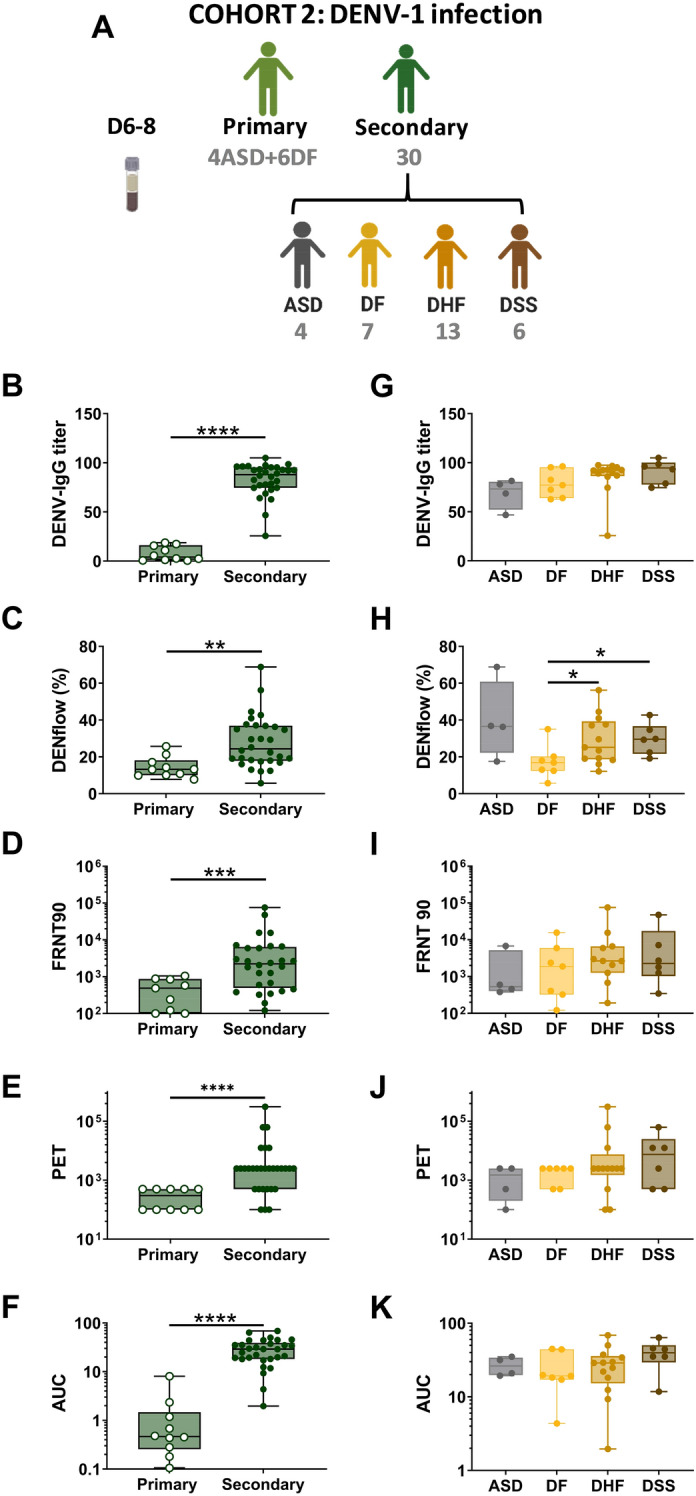
Figure 3.

Comparison of anti-DENV antibody responses in infected individuals with different immune status and clinical outcome. Graphical summary of plasma samples collected in cohort 2 (A). Plasma samples were collected at day 6 to day 8 after the day after laboratory-confirmed infection. Plasma samples in cohort 2 were analyzed for DENV IgG titer (B, G), percentage of IgG binding to DENV-1-infected cells (DENflow) (C, H), neutralizing antibodies (FRNT90) to DENV-1 (D, I) and ADE activity to DENV-1 expressed as PET (E, J) and AUC (F, K). Each point in the box plot represents an individual plasma sample. Whiskers show max, min, median values and the interquartile range beyond the 25th and 75th percentiles. Mann–Whitney test was used to compare groups. (*P < 0.05; **P < 0.01; ***P < 0.001; ****P < 0.0001).
