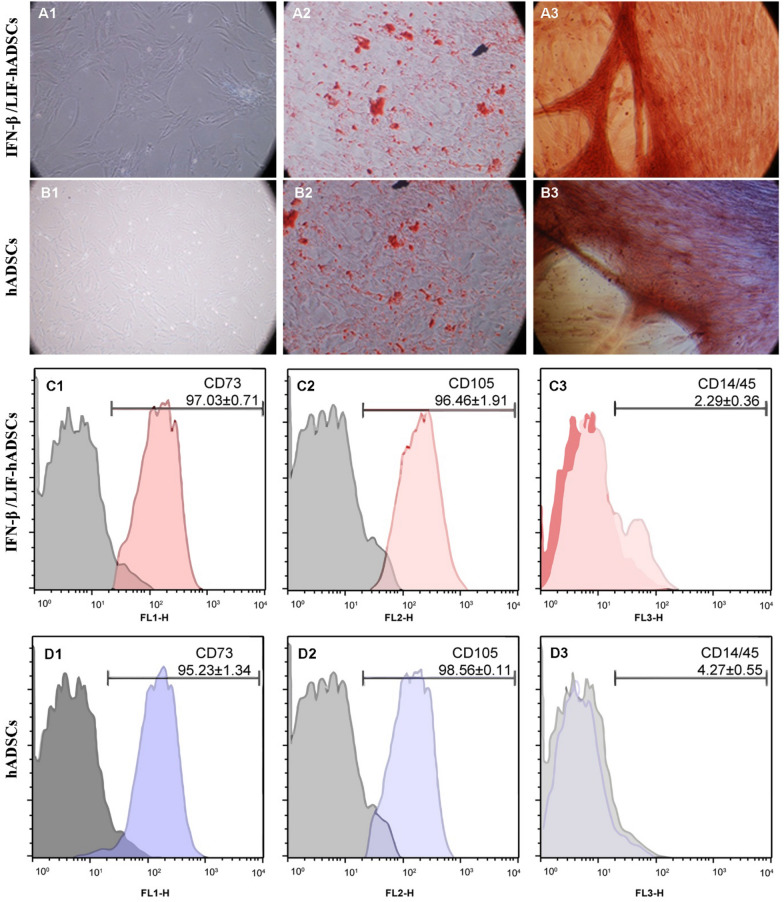
Figure 2.
Differentiation potential and cell surface characterization of transduced and un-transduced hADSCs. Phase contrast microscopy (A1 and B1) images show fibroblast-like morphology of transduced hADSCs. For abiogenic and osteogenic differentiation, transduced hADSCs were stained with Oil red (B2, A2) and Alizarin-Red (A3, B3), respectively. Scale bar, 100 µm. For the immunophenotypic profile of the transduced hADSCs, the cells were stained with selected CD marker antibodies (positive for CD73 and CD105, negative for CD14/45) (C, D). All cells were selected from the 3rd to 5th passages.

