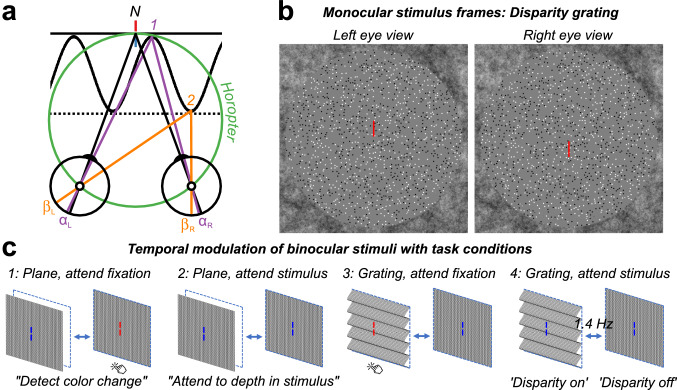
Figure 1.
(a) Top-down schematic illustration of absolute and relative disparity. Fixation point N (nonius lines) is on the zero-disparity plane defined by the horopter (green Vieth-Muller circle). Point 1 (purple) is also on the horopter and angles and are equal, meaning that the absolute disparity given by is zero. Point 2 (orange) is either on a second plane (dotted line) or on the peak of a disparity grating (sinusoidal line). At point 2, the absolute disparity, , is non-zero. The relative disparity between points 1 and 2 is the difference between the two absolute disparities, ( In contrast to the absolute disparity, the magnitude of the relative disparity is independent of fixation. (b) Random-dot stereopair used in the main experiment depicting a sinusoidal disparity grating (crossed disparity when cross-fused). The dots in the actual experiment were dynamic. (c) Schematic of different stimuli, task conditions, and temporal modulation between crossed disparity, ‘disparity on’, and zero disparity, ‘disparity off’ phases. Participants were asked to detect a brief color change on the fixation lines, or to attend to the depth modulation of the stimulus, for either plane (absolute disparity only) stimuli or grating (absolute and relative disparity) stimuli. To generate a visual-evoked potential, all stimuli modulated between disparate and non-disparate states at 1.4 Hz.

