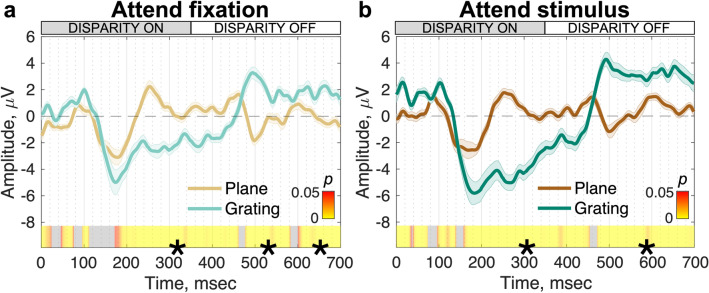
Figure 3.
Cycle averages of VEP responses to disparity changes for plane and grating stimuli under ‘attend fixation’ (a) and ‘attend stimulus’ (b) task conditions (N = 20). In both panels, VEP waveforms are reconstructed via the nF1 clean filter and are weighted by the first reliable component (topographies in Fig. 2). Waveforms are group-level mean responses to a single stimulus cycle consisting of one ‘disparity on’ transition at 0 ms and a ‘disparity off’ transition at ~ 357 ms. Errors are 1 SEM. The heat bar indicates the p-value significance of the plane (brown colors) vs. grating (green colors) responses calculated via permutation-based paired t-tests. Segments marked with (*) indicate sequential, significant time points that pass the threshold for run-length correction and grey = nonsignificant.

