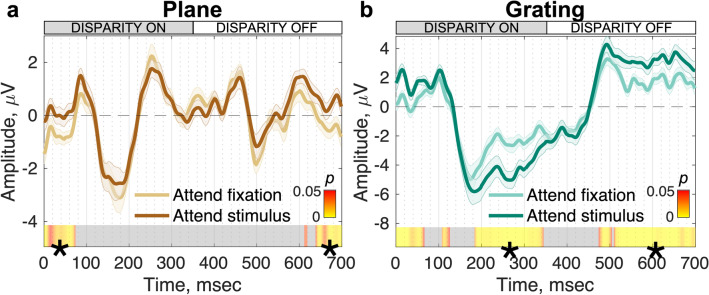
Figure 4.
EEG responses to plane and grating disparity stimuli under different task demands (N = 20). (a) Responses to the plane (pure absolute disparity) stimulus. Responses during attend fixation (light brown) and attend stimulus (dark brown) conditions are highly similar and transient waveforms are observed at both disparity on and disparity off stimulus transitions. (b) Responses to the grating (relative and local absolute disparity) stimulus. Responses during the attend fixation (light green) and attend stimulus (dark green) are initially similar up to ~ 184 ms when they begin to diverge. For both panels, data are the group mean waveform in RC1, and errors are 1 SEM. Data have been filtered using the nF1 clean filter. Heat bars indicate significance (paired-samples t-test) and segments marked with (*) indicate sequential, significant time points that pass the threshold for run-length correction and grey = nonsignificant.

