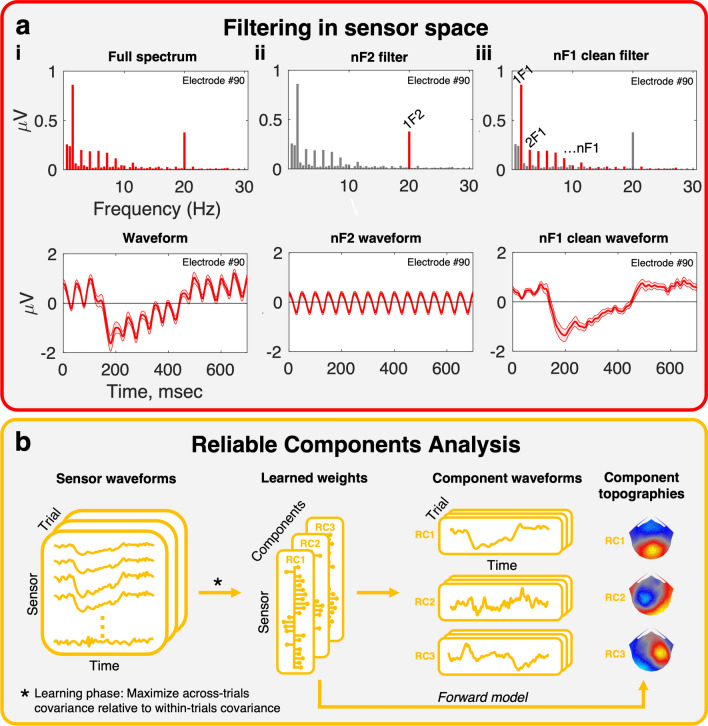
Figure 7.
Two key stages in the data processing pipeline. (a) Filtering in sensor-space. Fourier pairs (spectra on the top row, and corresponding waveforms on the bottom row) illustrate different filter types. The full spectrum, a(i), contains both signal and noise harmonics, dominated by signals at multiples of the fundamental frequencies in the stimulus. This signal can be filtered to highlight different response components. The nF2 filter, a(ii), removes all frequencies in the response except those at multiples of 1F2 (in our stimuli, the dot update rate at 20 Hz). The dot update can also be removed, and the disparity response highlighted, using the nF1 clean filter, a(iii). Here, multiples of the 1F1 fundamental (in our stimuli, disparity update at 2 Hz) are preserved and all other frequencies are removed. The reconstructed waveform is a “clean” version of the full waveform, with non-disparity and dot update signals removed. (b) Dimensionality reduction via Reliable Components Analysis. The nF1 clean data are provided as input to the RCA pipeline, where components are learned that maximise the across-trials covariance relative to the within-trials covariance. Components are vectors of electrode weights where electrodes that respond in a consistent manner across trials are emphasized. These learned weights can be projected through a forward model, revealing underlying neural sources in the form of component topographies. Trial data are projected through the weight vectors to generate mean responses for each component, reducing the dimensionality of the data from 128 sensors to a small number of reliable components. Typically RCA is run on the group level, where input data are individual participant trials but weights are learned across all participants, resulting in group-level topographies and group-level waveforms.

