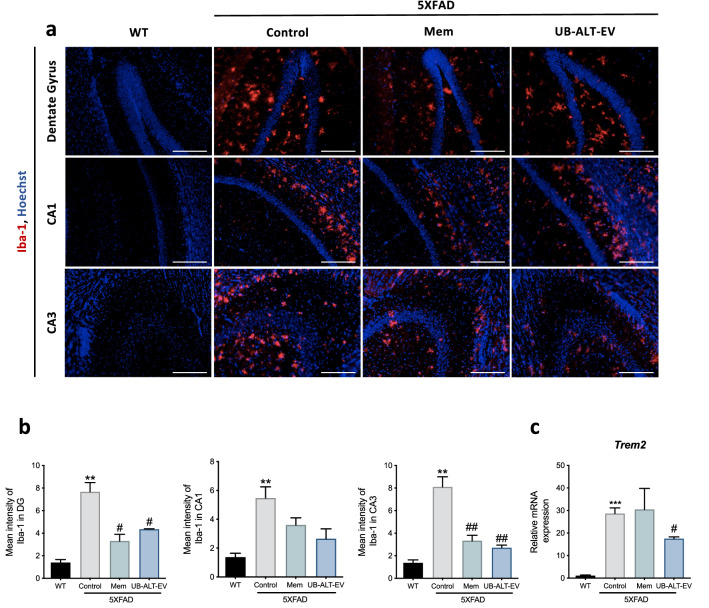
Figure 2.
Treatment-induced changes in the expression of microglial activation markers with NMDA receptor antagonists in 5XFAD of 6 months of age. Representative Iba-1 (Red) and Hoechst (Blue) positive staining in dentate gyrus, CA1 and CA3 hippocampal areas (a). Scale bars: 200 μm. Mean intensity of Iba-1 staining in dentate gyrus, CA1 region, and CA3 region (b). Representative gene expression for Trem2 (c). Values are the mean ± Standard error of the mean (SEM); (n = 3 for WT and Control groups and n = 4 for Mem and UB-ALT-Ev groups. For WT vs. 5XFAD Control groups data was analyzed using a two-tail Student’s t-test, and for 5XFAD groups a standard one-way ANOVA followed by Tukey post-hoc analysis was performed. **p < 0.01; ***p < 0.001 for WT vs. Control. #p < 0.05; ##p < 0.01 for Mem or UB-ALT-EV vs. Control.

