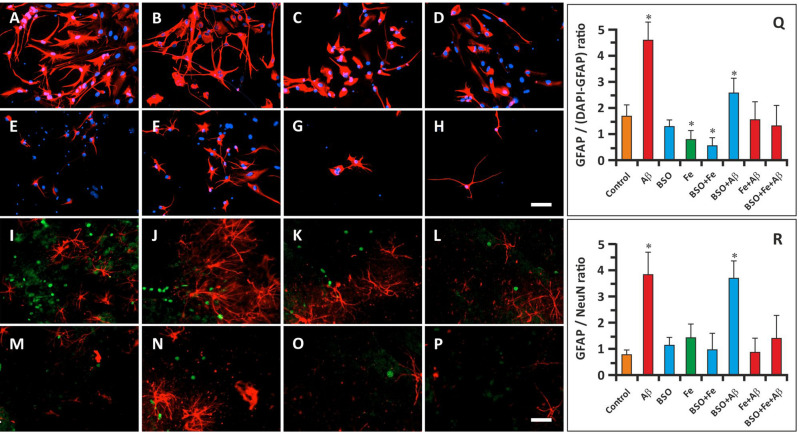
Figure 2.
Effect of Aβ, BSO, and Fe2+ on the ratio of glial cells to neuronal cells and glial and neuronal morphology. (A–H) Immunostaining of GFAP (red) and DAPI staining (blue) in hippocampal cells on the 14th day of cultivation. Scale bar, 100 μm. (I–P) Immunostaining of GFAP (red) and NeuN staining (green) in hippocampal cells on the 14th day of cultivation. Scale bar, 200 μm. (Q) GFAP+/(DAPI+-GFAP+) cell ratio. (R) GFAP+/NeuN+ cell ratio. n = 10. * P < 0.05. The error bars indicate the mean ± SD.

