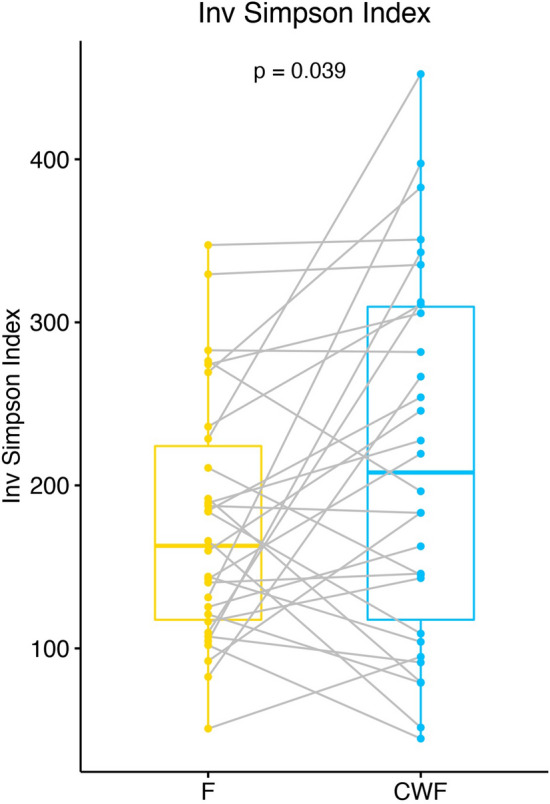
Figure 2.

Dumbbell plot of alpha diversity, measured using the Inverse Simpson’s richness index, for matched F and CWF samples. Alpha diversity scores were calculated by using rarefied data at an equal sampling depth of 68,000 sequences. Box-plot and points represent the overall data distribution and samples, respectively. Samples belonging to the same enrolled subject were connected by using a grey line. The group mean comparison was performed by using the Student’s t-test.
