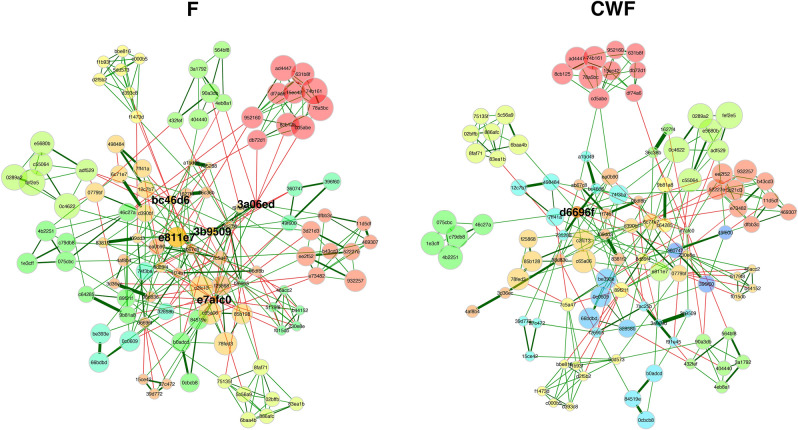
Figure 8.
F and CWF microbial networks obtained by using the NetCoMi framework. Nodes are sized and coloured according to normalized counts and cluster membership. Edges color reflects the correlation among nodes (green and red for positive and negative correlations, respectively). In particular, cluster sharing at least 5 nodes among the two networks were plotted using the same colour. Details about node name and taxonomic classification are available in Supplementary Table S6.

