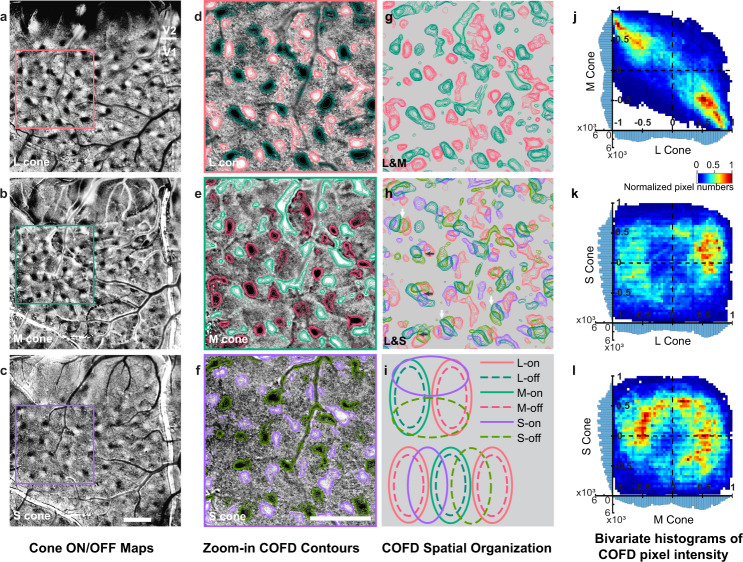
Fig. 4. Spatial relationships between L-, M-, and S-COFDs.
a–c COFDs from ISI phase maps in response to full-field periodic L-, M-, and S-cone-isolating stimuli, respectively. Scale bar in c: 1 mm; applies to a–c. d–f Zoom-in views of maps in a–c. Color contours for ON and OFF domains are overlaid on images based on ISI pixel values. Scale bar in f: 1 mm; applies to d–h. g Merged image of L-COFD contours (d) with M-COFD contours (e). Same scale as f. h Merged image of L-COFDs (d) with S-COFDs (f). Same scale as f. Additional examples are shown in Supplementary Fig. 2a. L- and M-COFDs overlap extensively with an anti-phase relationship; L-on COFDs align with M-off COFDs, and L-off align with M-on (g, also see j). In contrast, S-ON and S-OFF COFDs tend to fall between and partially overlap with L+M− and M+L− COFDs (h, also see k, l). i Schematic diagrams of the COFD relationships often seen in h. L+M−/M+L− pairs are often grouped with an S+/S-pair such that the pairs have orthogonal axes (h, dark arrows, schematized at top of i). Alternatively, the pairs are arranged in parallel with S+ and S− COFDs interdigitating between L+M− and M+L− COFDs (h, white arrows, schematized at bottom of i). j–l 2D Bivariate histograms illustrating spatial relationships between L, M, and S COFDs. The 1D histograms on the x- and y-axes display the distribution of normalized pixel values in each category. (Additional cases are shown in Supplementary Fig. 2a). The anti-phase relationships between L and M COFDs are apparent in j, while interactions between L or M with S-COFDs are more balanced across all phases (k and l).

