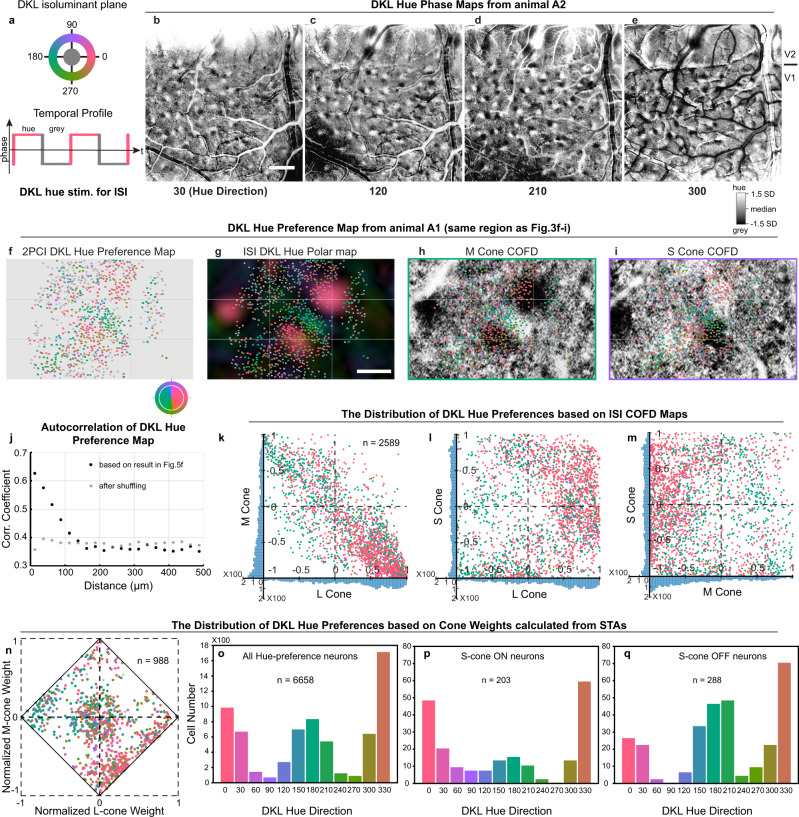
Fig. 5. DKL hue map and its relationships to COFDs and Cone weights.
a Schematic of stimulus presentation. b–e ISI hue-phase maps in response to 4 hue directions (animal A2). Scale bar in b: 1 mm; applies to b–e. (SD: standard deviation of pixel distributions). f DKL hue preference map from same imaging region as Fig. 3f–i. Individual neurons are depicted based on their preferred DKL hue or gray (not hue selective). Color key indicates the relationship between the hues for plotting the map (outer ring) and hues used for stimulation (inner disk). g DKL hue preference map (from f) overlaid on DKL hue polar map from ISI. h, i DKL hue preference map (from f) overlaid on M-cone and S-cone COFDs (from Fig. 3g, h). Scale bar in g: 200 µm; applies to f–i. j Autocorrelation of neuronal hue preferences from f as a function of cortical distance. Black dots are from actual data shown in f; gray dots are from the same data after shuffling. k–m Relationships between ISI COFD organization and DKL hue preferences based on individual neurons identified by 2PCI. Each dot represents a neuron which is within COFD, and its x y coordinates are the mean normalized pixel values within that neuron from COFD maps (see Methods). Histograms on x and y-axes show the distributions of neurons based on normalized pixel values from ISI. Individual neurons are colored according to their preferred DKL hue. n Relationships between DKL hue preferences and cone weights calculated from STAs. 988 neurons with significant L, M, or S-cone STA from 5 imaging regions (10 planes, see Supplementary Fig. 5) of A1 were selected to calculate normalized cone weights. Normalized L and M-cone weights are plotted on the x- and y-axes and S-cone weights are implicit as the distance from the edge. Data point colors show preferred DKL hues (or gray for not hue selective). o–q Distributiond of preferred DKL hues of all hue-selective neurons (o), hue-selective neurons with significant S-ON STA (p), or with significant S-OFF STA (q). (5 imaging regions, 10 planes, from A1.).

