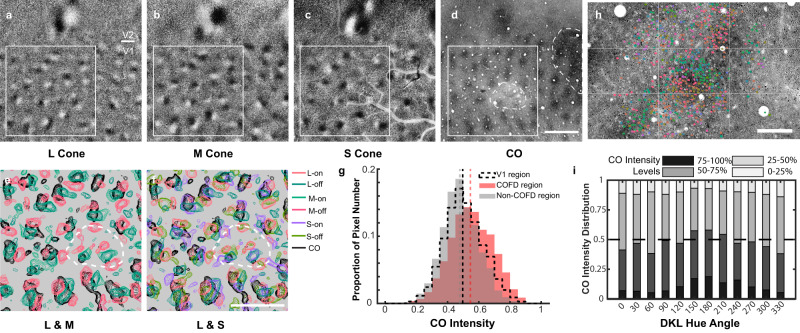
Fig. 7. Spatial relationship between COFDs and CO blobs.
a–c L- (a), M- (b), and S-cone (c) COFD maps of V1 and V2 from animal A5. d CO image after alignment. It is the same region shown in a–c. Scale bar in d: 1 mm; applies to a–d. e, f Zoom-in view of the COFD and CO contours from the region within the white square shown in a–d. More cases are shown in Supplementary Fig. 7a. Scale bar in f: 1 mm; applies to e and f. g Histogram of CO intensity distributions in COFD, non-COFD and whole V1 regions. Dashed lines are median of the distribution in each region. The CO intensity distribution in COFD regions is significantly higher than that in non-COFD regions (n = 96 COFD regions, P = 0.0062, Wilcoxon signed rank test, two-sided). Note that dotted white outline in d–f indicates region restricted from quantitative analysis due to damage by an electrode penetration (subsequent to ISI data collection) and loss of CO staining. h DKL hue preference map overlays on top of cytochrome-oxidase (CO) histology. Scale bar in h: 200 µm. Note that h is the same region shown in Fig. 3f–i and Fig. 5f–i. Grids were added as landmarks for comparison. i CO intensity distribution of DKL hue preference neurons. Each column is the CO intensity distribution (grouped as four levels) of pixels corresponding to the neurons (based on the alignment shown in h) prefer the hue direction shown on x-axis. Results are from 5 regions (10 planes, see Supplementary Fig. 5); h is one example.

