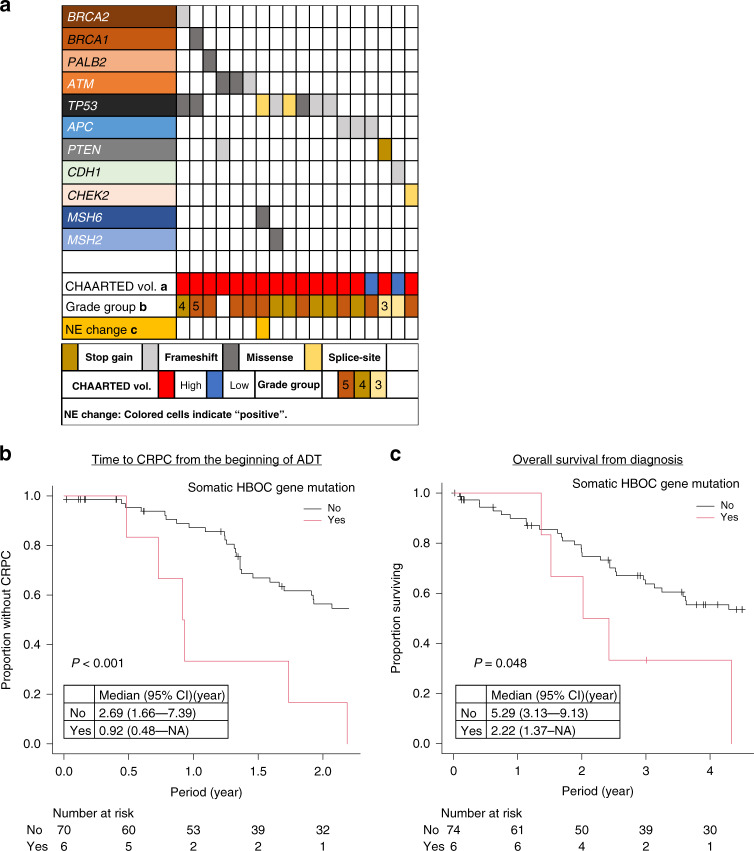
Fig. 4. Summary of the genetic and clinical profiles of patients with somatic variants in the 27 analysed genes.
a Summary of the genetic and clinical profiles of patients with somatic mutations in the 27 analysed genes. b Kaplan–Meier curve showing time to castration resistance from initiation of androgen deprivation therapy (ADT) for patients with or without somatic mutations in HBOC-associated genes (BRCA1, BRCA2, PALB2 or ATM). Group differences were tested by performing log-rank tests. c Kaplan–Meier curve showing overall survival from the time of diagnosis for patients with and without somatic mutations in HBOC-associated genes.

