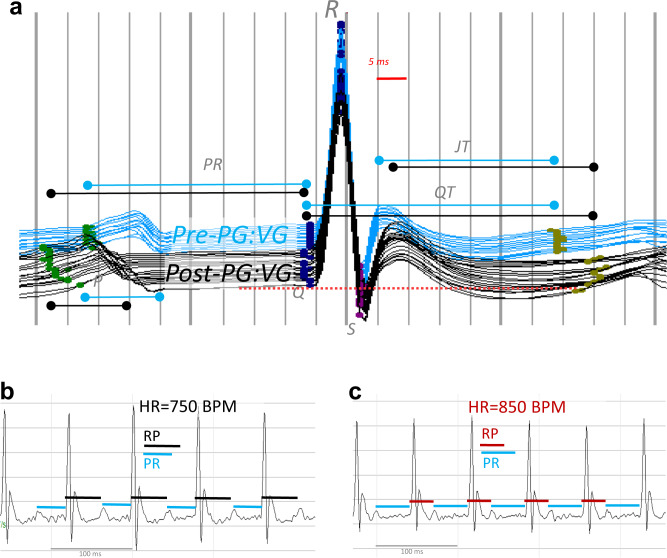
Fig. 4. Representative ECG waveforms of E-cig exposed mice.
a Waterfall plot of successive 1-min average ECG waveforms for a single mouse at pre-exposure (blue) and 4–9 min after (black) each PG:VG puff session. Horizontal lines indicate approximate mean P duration, PR, QT, and JT intervals for pre- (blue) and post-exposure (black). Waveform dots indicate P-begin (green), Q-begin (navy blue), R peak (navy blue), S (purple), and T-end (olive). After T-end, the next P appears as a rise above the isoelectric line (red dashed line for final 1-min average wave). b Normal conduction under physiological sinus rhythm with RP > PR in a single menthol e-cigarette-exposed mouse 30 s preceding onset of AV reentrant tachycardia (AVRT), as shown in c, when HR > 800 BPM and RP < PR, lasting 12 min.

