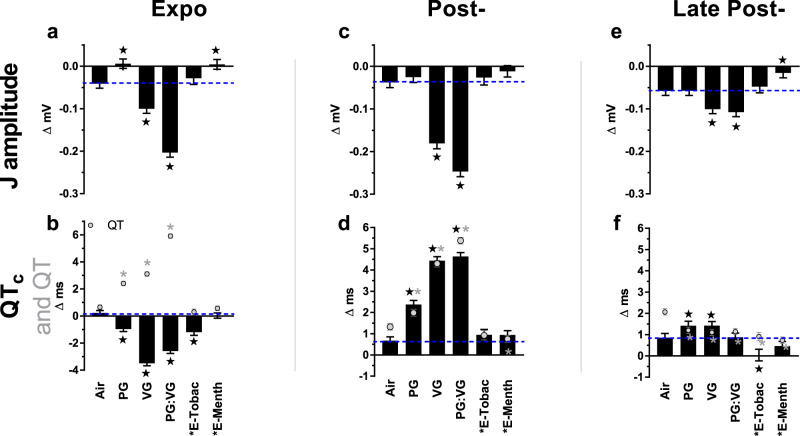
Fig. 5. Inhalation exposure to E-cig aerosols alters ventricular repolarization.
Bars represent least square means (±SEM) of change from 5-min baseline in J amplitude, QTc interval, and uncorrected QT (gray circles) according to exposure phases (a–f). Significance determined by two-sided P < 0.05 (vs. Air: star for J amplitude and QTc and gray asterisk for QT) in mixed model analyses. Blue dashes mark Air mean. Black asterisk indicates nicotine present. “E-Tobac” and “E-Menth” denote E-Tobacco and E-Menthol. For averages of individual subjects by phase, and simple means and standard errors of Air (n = 8), PG (n = 7), VG (n = 7), PG:VG (n = 8), E-Tobac (n = 4), and E-Menth (n = 6) treatments, see Supplementary Fig. 6. Source data, including all p values, are provided as a Source Data file.

