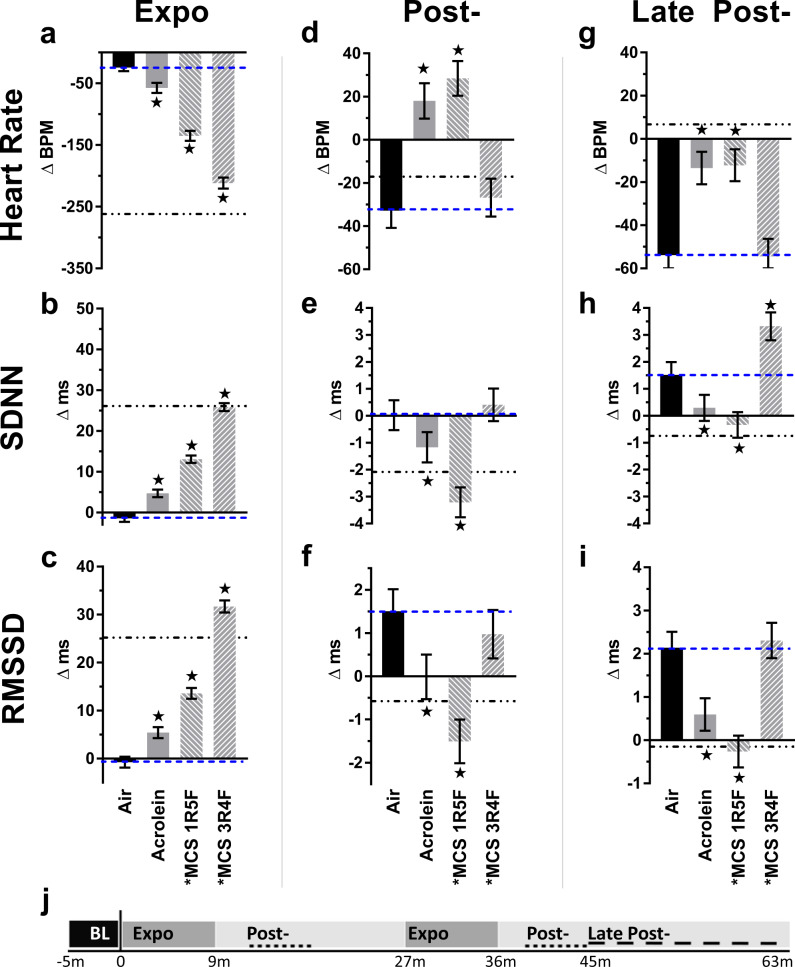
Fig. 7. Inhalation exposure to MCS or acrolein alters heart rate and heart rate variability (HRV).
Bars represent least square means (±SEM) of change from baseline in heart rate and HRV (SDNN and RMSSD) at different exposure phases (a–i), indicated by timeline below (j), with Expo denoting puff sessions, Post- denoting 4–9 min after each puff session, and Late Post- indicating 9–28 min after final puff session. Blue dashes mark Air mean (n = 8) and dot-dashes mark VG mean reference. Significance determined by two-sided P < 0.05 (vs. Air: star) in mixed model analyses. For Acrolein and MCS 1R5F, n = 8, and for MCS 3R4F, n = 6. Asterisk indicates nicotine present. For averages of individual subjects by phase, and simple means and standard errors, see Supplementary Fig. 9. Source data, including all p values, are provided as a Source Data file.

