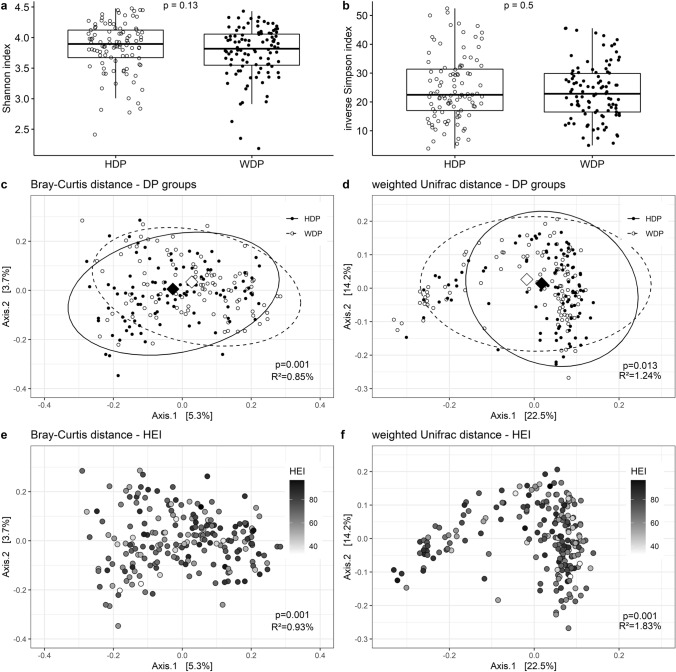
Fig. 4.
Plots illustrating bacteria diversity in the study group: α-diversity showing Shannon (a) richness and inverse Simpson index (b); β-diversity showing PCoA plots (centroids marked with diamonds) of Bray–Curtis (c, e) and weighted Unifrac (d, f) distances on the ASV level. The results of statistical analysis have been shown on each plot (Mann–Whitney U-test for a and b, and PERMANOVA for c, d, e and f). Plots c and d show associations with the DP groups, whereas plots e and f show associations with diet quality, as measured by HEI

