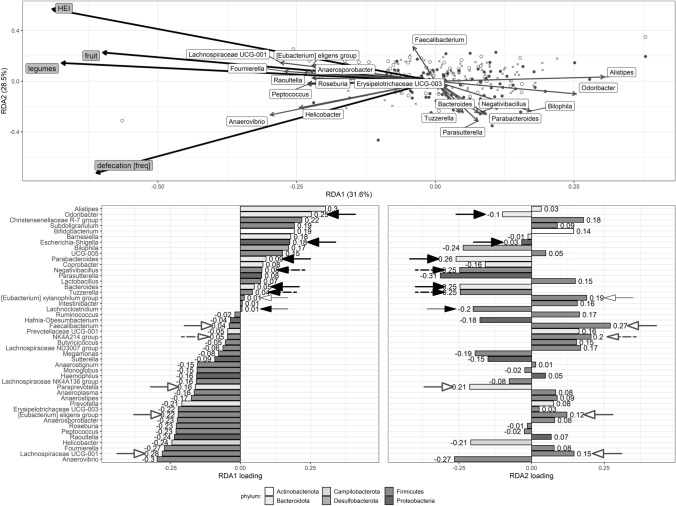
Fig. 6.
RDA plots showing factors that significantly explain the variance in the microbiota composition and the loadings for each component of RDA1 and RDA2 (stepwise-built Model 4 shown in Supplementary resource 4). Study participants’ weighted scores are represented by black-filled circles (WDP) and empty circles (HDP). Crosses show scores for genera. Thick black arrows represent explanatory variables, while thin grey arrows represent genera. Genera that were weakly associated with the first two axes are omitted for clarity. Loadings for RDA1 and RDA2 axes are shown below. Bars for the genera with significantly higher relative abundance in people with WDP and HDP (LEfSe result) have been indicated with black-filled and white-filled arrows, respectively (thicker arrows correspond to bacteria where log10(LDA score) > 2.0, thinner lines to bacteria where 1.8 < log10(LDA score) < 2.0, whereas dashed arrows to bacteria differentially abundant shown only in Mann–Whitney U-test)

