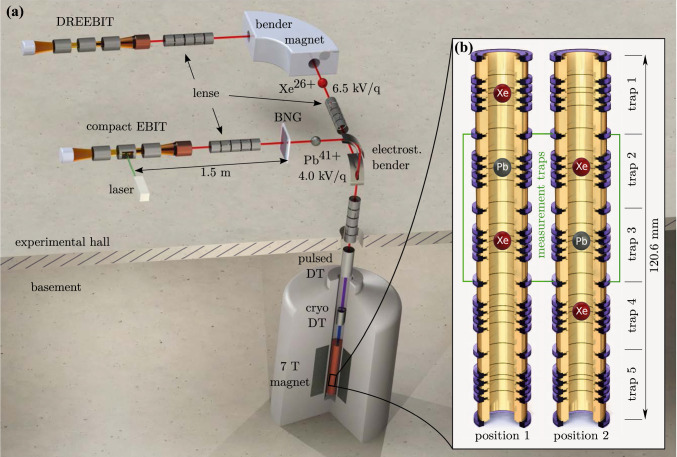
Fig. 1.
a Schematic illustration of the ion production section, the two beamlines, and the combined deceleration region ending in the trap chamber. The ion bunches with their respective energies are shown after they have been q/m selected by the bender magnet or the Bradbury-Nielson gate (BNG). b Schematic drawing of the Penning-trap tower with two measurement ion configurations. The ions are moved from position 1–2 or back every min. The frequency measurements are carried out in traps 2 and 3. Traps 1 and 4 are utilized as storage traps and trap 5 is currently not in use but is planned to be used to monitor magnetic field fluctuations in the future

