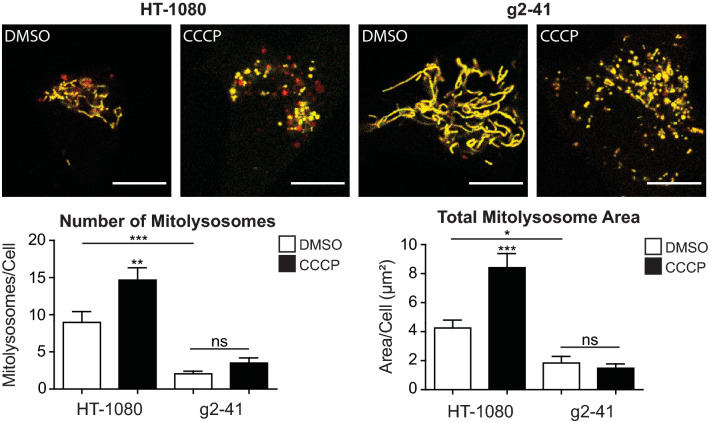
Fig. 3.
mitoKeima detection of Gp78-dependent basal mitophagy in HT-1080 cells. Wild-type HT-1080 cells and g2-41 knockout CRISPR clones were transfected with mito-Keima and treated with DMSO or CCCP for 24 h. Confocal fluorescence images show mito-Keima in both neutral (yellow) and low pH (red) environments. Accumulation of mitolysosomes (red) is observed selectively in HT-1080 cells and increased upon CCCP treatment. Quantification of both the number of mitolysosomes per cell and the total area of mitolysosomes per cell is shown in the bar graphs (Scale bar: 10 μm; n = 3 independent biological replicates; > 10 cells/condition per experiment; *, p < 0.05; **, p < 0.01; ***, p < 0.001; ns, no significance; Mean ± SEM)

