Fig. 4.
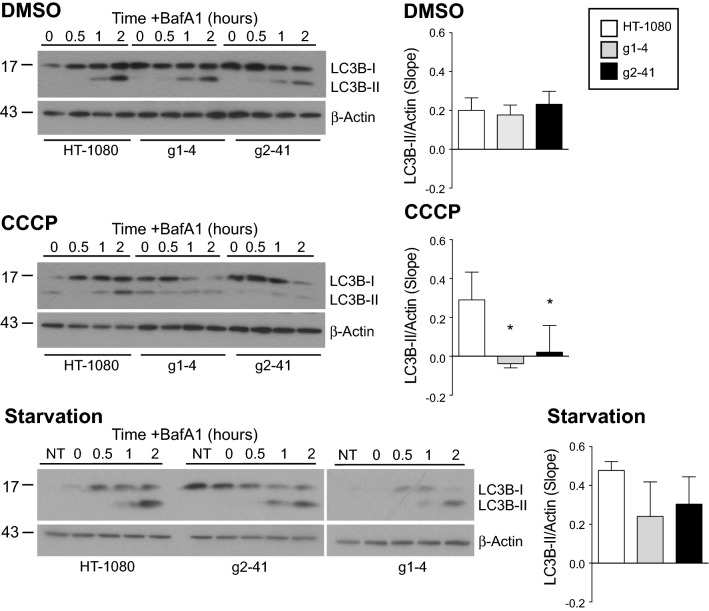
Flux of autophagy protein LC3B-II in wild-type HT-1080 and Gp78 knockout cell lines. Western blot analysis and probing of LC3B-II in HT-1080 cells and g1-4 and g2-41 Gp78 knockout CRISPR/Cas clones after 4 h treatment with either DMSO, CCCP or starvation in presence of 100 nM of BafA1 for 0, 30, 60 and 120 min. DMSO or serum-starved cells show increased and accumulated LC3B-II with BafA1 in time-dependent manner. The slope of LC3B-II band density quantified relative to β-actin show significant differences between the three cell lines; LC3B-II flux upon CCCP treatment of HT-1080 cells but not in the Gp78 knockout clones can be seen (n = 4 independent biological replicates; *, p < 0.05; Mean ± SEM; full blots shown in Supp. Figure 7)

