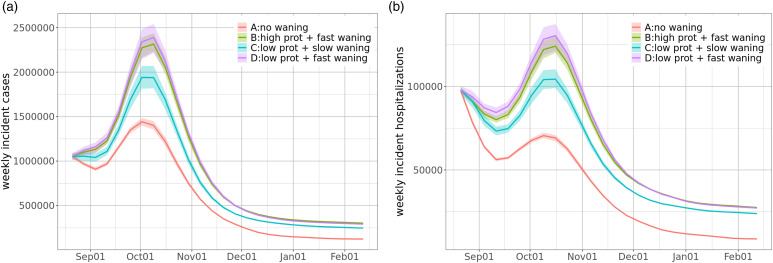
Figure 13.
Projections of (a) weekly incident cases and (b) weekly incident hospitalizations in the US from Aug. 2021 to Feb. 2022 under four different scenarios. Note that the ribbons show interquartile ranges of the probabilistic projections. (a) As expected, there will be more cases with fast waning and the effect of protection is relatively small; and the assumption of no waning substantially underestimates the cases. In all scenarios, we will see cases peak in early October, then start decreasing. (b) We have similar observations regarding hospitalizations, except that the effect of protection on hospitalizations seems more significant.

