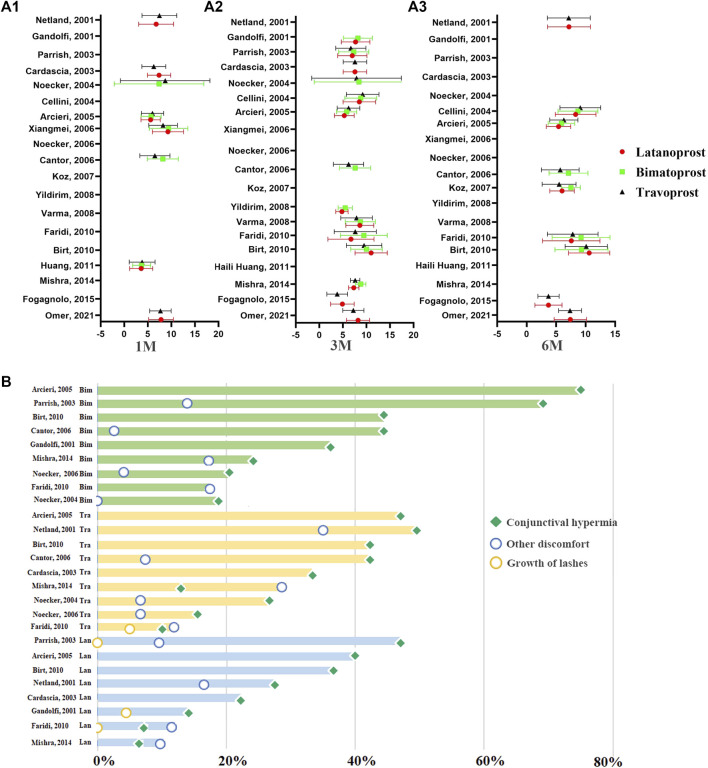
FIGURE 1.
The distribution of IOP-lowering efficacy of PGAs at different time points of therapy and the distribution of ocular side events of PGAs in previous RCTs. (A) The distribution of the IOP-lowering efficacy of PGAs at 1M, 3M, and 6M. The abscissa represents the mean IOP reduction from baseline to the endpoint. The ordinate represents the data from different reported literatures. (A1): The distribution of IOP-lowering efficacy of PGAs at 1 month. (A2): The distribution of IOP-lowering efficacy of PGAs at 3 months. (A3): The distribution of IOP-lowering efficacy of PGAs at 6 months. Red circle: Latanoprost; Green square: Bimatoprost; Dark triangle: Travoprost. (B) The distribution of ocular side events of PGAs in previous RCTs. The horizontal axis represents the incidence of ocular side effects. The pale green columns in the top represent the ocular side effects in Bimatoprost. The faint yellow columns in the middle represent the ocular side effects in Travoprost. The pale blue columns in the bottom represent the ocular side effects in Latanoprost. Green square: conjunctival hyperemia; yellow circle: growth of eyelashes; blue circle: other discomfort.

