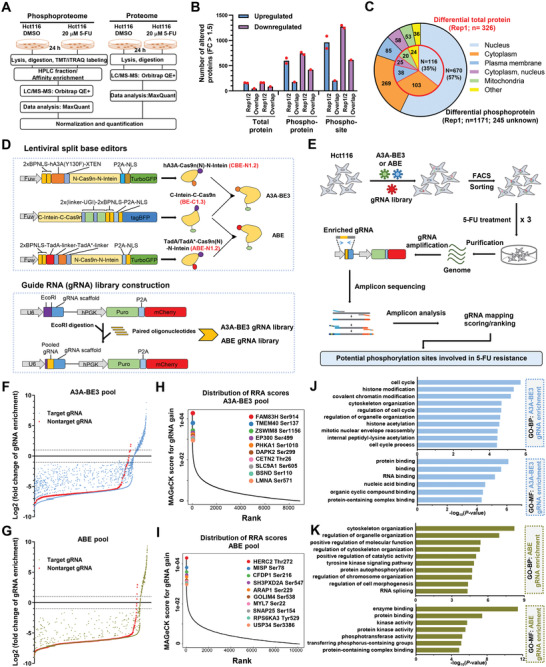
Figure 1.

CRISPR‐mediated base editing screening of functional phosphorylation sites in 5‐FU treatment. A) The diagram describing the strategy for proteome analysis to detect total (proteome) and phosphorylation (phosphoproteome) proteins upon 5‐FU (20 × 10−6 m) treatment. B) Bar plot showing the number of altered proteins relative to control group with fold change (FC) > 1.5. Two replicates (Rep1 and 2) and overlapped proteins were presented for each group. C) Pie chart showing the number or proportion of differential total and phosphorylation proteins located at differential position within a cell (taking Rep1 as an example). D) The schematic diagram showing the structure of split base editor and gRNA expression vectors using a lentiviral system. E) The schematic diagram describing the procedures for BE‐mediated screening during 5‐FU (20 × 10−6 m) treatment and resistance formation. F,G) The distributions of gRNA enrichment (log2FC) relative to control group before 5‐FU treatment. The enrichment for gRNAs from A3A‐BE3 pool was presented in (F) and the enrichment for gRNAs from ABE‐BE3 pool was presented in (G). Red triangles indicate the enrichment of non‐targeting control gRNAs. H,I) Top depleted genes (gRNA enrichment) in 5‐FU resistant cells versus control cells before 5‐FU treatment presented as MAGeCK RPA scores using the MAGeCK algorithm. J,K) Gene ontology (GO) analysis of genes targeted by gRNAs that were significantly enriched relative to control group before 5‐FU treatment from J) A3A‐BE3 or K) ABE‐BE3 pool respectively. Two types of GO terms, including biological process (BP) and molecular function (MF), were presented.
