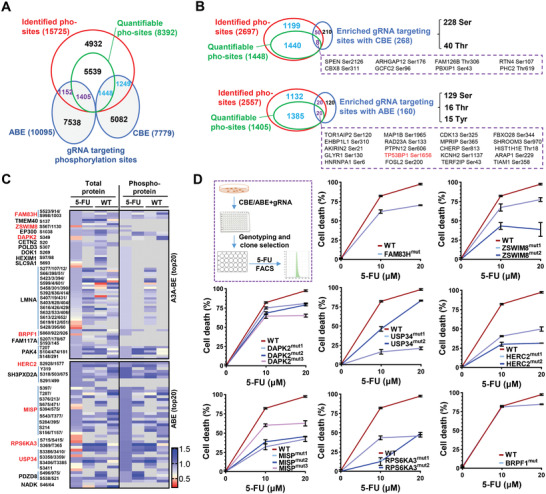
Figure 2.

Validation of top screen hits via individual amino acid mutations. A) Veen diagram showing the number of overlapping phosphorylation sites targeted by A3A‐BE3 or ABE‐BE3 pool with that detected by mass spectrum analysis (identified or quantifiable). B) Veen diagram showing the number of overlapping phosphorylation sites targeted by significantly enriched gRNAs from A3A‐BE3 (n = 268) or ABE‐BE3 (n = 160) pool with that detected by mass spectrum analysis (identified or quantifiable) and targeted by total pools. Top enriched gRNA targeting phosphorylation sites overlapped with quantifiable phosphorylation sites are presented. C) Normalized quantification of protein peptides containing phosphorylation sites (all phosphorylation sites reported within top 20 hits from A3A‐BE3 or ABE‐BE3 pool) in total protein or phosphorylation protein analysis. Two replicates were presented for each treatment. Gray boxes indicate peptides not detected in spectrum analysis. Genes presented in top 10 (Figure 1H,I) are highlighted in blue. D) Hct116 cells were transfected with CBE or ABE tools and targeting gRNAs to establish single cell clones containing expected mutations. One, two, or three clones containing expected mutations to disrupt phosphorylation sites were subjected to apoptotic assays in responding to 5‐FU (10 × 10−6 or 20 × 10−6 m) treatment for 72 h.
