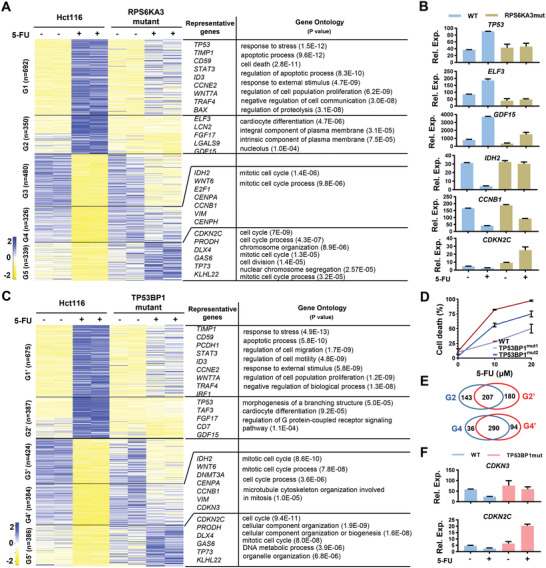
Figure 3.

RSK2 and TP53BP1 mediate 5‐FU‐induced transcriptomic alterations. A) RNA‐seq analysis of differentially expressed genes in control (Hct116) or RPS6KA3 mutant cells without or without 5‐FU (20 × 10−6 m) treatment. Five group of genes (G1‐G5) with different features were presented. Representative genes and GO analysis for G1, G2, G4, and G5 groups were presented (P values for GO terms were also presented). B) Relative expression (Rel. Exp.) of TP53, ELF3, GDF15, IDH2, CCNB1, and CDKN2C was presented as FPKM in control (WT/Hct116) or RPS6KA3 mutant cells without or without 5‐FU treatment from RNA‐seq analysis. C) RNA‐seq analysis of differentially expressed genes (G1’‐G5’) in control (Hct116) or TP53BP1 mutant cells without or without 5‐FU treatment. Representative genes and GO analysis for G1’, G2’, G4’, and G5’ groups were presented (P values for GO terms were also presented). D) WT/Hct116) or TP53BP1 mutant cells were subjected to apoptotic analysis in responding to 5‐FU (10 × 10−6 or 20 × 10−6 m) treatment for 72 h. E) Veen diagram showing the number of overlapping genes between G2 versus G2’ or G4 versus G4’. F) Relative expression (Rel. Exp.) of CDKN3 and CDKN2C was presented as FPKM in control (WT/Hct116) or TP53BP1 mutant cells without or without 5‐FU treatment from RNA‐seq analysis.
