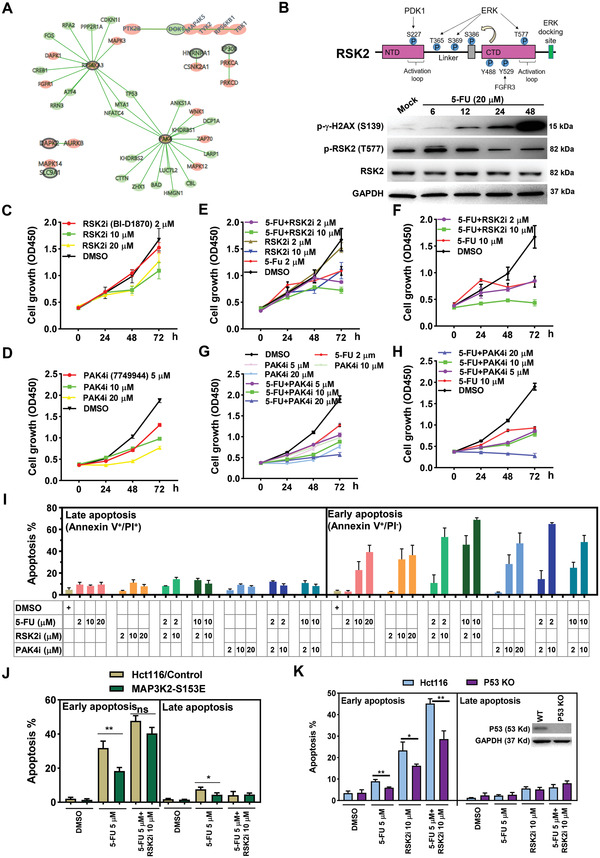
Figure 4.

RSK2 or PAK4 inhibitors enhancer 5‐FU‐induced cell growth inhibition and apoptosis in colorectal cancer cells. A) Top 20 screen hits were subjected to phosphorylation network analysis using an online tool (http://phosphorylationnetworks.org). Black circled genes were from screen hits, genes with pink background represent known kinases, and genes with green background represent classical downstream targets. B) The upper panel displays the phosphorylation sites and functional domains (NTD, NH2‐terminal kinase domain; CTD, C‐terminal domain) identified within RSK2 protein as well as their catalyzing kinases (PDK1, ERK, FGFR3). The upper panel showing the results from western blot analysis of total RSK2, phosphorylated RSK2 at Thr577 (p‐RSK2 T577), and GAPDH expression in mock or 5‐FU‐treated Hct116 cells (20 × 10−6 m for 6, 12, 24, and 48 h). C,D) Relative cell growth rates of Hct116 cells treated with increasing concentrations of RSK2 inhibitor (RSK2i) or PAK4 inhibitor (PAK4i). E–H) Relative cell growth rates of Hct116 cells co‐treated with 5‐FU (2 × 10⁻⁶ or 10 × 10−6 m) and RSK2i or PAK4i. I) Apoptotic analysis of Hct116 cells co‐treated with 5‐FU (2 × 10⁻⁶ or 10 × 10−6 m) and RSK2i or PAK4i. Proportions of early (Annexin V+/PI–) or late (Annexin V+/PI+) apoptotic cells were presented. J) Apoptotic analysis of Hct116 cells expressing control vector or MAP3K2‐S153E. Cells were treated with 5‐FU (5 × 10⁻⁶ m) or 5‐FU and RSK2 inhibitor (10 × 10−6 m) combinations for 72 h, and the proportions of early and late apoptotic cells were determined. K) Wildtype or P53 knockout (P53 KO) Hct116 cells were treated with 5‐FU (5 × 10⁻⁶ m), RSK2 inhibitor (10 × 10−6 m), or their combinations. Apoptotic assays were performed at 48 h. Western blot analysis was conducted to detect the expression of P53 in wildtype and P53 KO cells.
