
Figure 2.
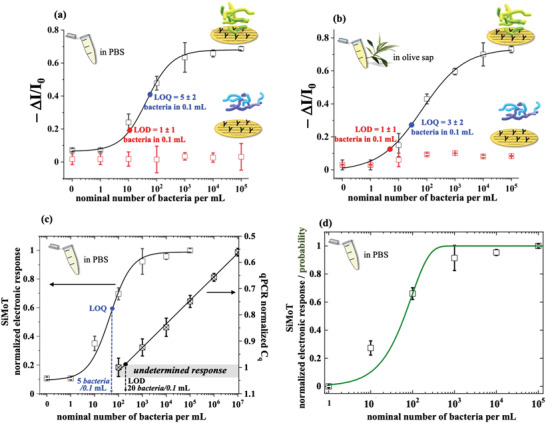
SiMoT assays in PBS and in olive sap solutions spiked with X. fastidiosa and PsJN bacteria, benchmarked toward qPCR: a) Dose curves of the X. fastidiosa electronic SiMoT assay carried out in PBS standard solutions with concentrations in the 0–105 bacteria per mL range. The electronic response is taken as the negative of the relative current shift (I) with the respect to the baseline I 0 (−ΔI/I 0). The black hollow squares are the data measured with the sensing gate in the Xylella‐containing samples, while the red hallow squares are those measured in the negative control experiment that assays the non‐target PsJN. Error bars over three replicates are set as one standard deviation. The modeling (black solid curve) has been performed with an analytical model based on a 4‐parameter logistic equation (see Experimental Section), whose four parameters are: (−ΔI/I 0)max = 0.68 ± 0.01, (−ΔI/I 0)min = 0.07 ± 0.01, x 0 = 44 ± 14 bacteria per mL and a p = 0.97 ± 0.2, leading to an average distribution of the number of anti‐Xf in each domain of = 4.2 × 10¹⁰. The LOD, taken as the average of the control experiment data (noise level) plus three times the standard deviation, is equal to 1 ± 1 bacterium in 0.1 mL (10 cfu/mL or equivalently 10 bacteria per mL). The LOQ (by the definition the level of the average of the control experiment data plus nine times the standard deviation) is equal to 5 ± 2 bacteria in 0.1 mL (54 bacteria per mL). b) Dose curves of the X. fastidiosa electronic SiMoT assay carried out in 0.1 mL olive sap from Xylella‐free olive sources, added with bacteria to spam concentrations in the 0–105 bacteria per mL range. The modeling (solid black curve) has been performed with an analytical model based on a 4‐Parameter logistic whose parameters are: (−ΔI/I 0)max = 0.74 ± 0.02, (−ΔI/I 0)min = 0.01 ± 0.03, x0 = 67 ± 21 bacteria per mL and p = 0.97 ± 0.1. The average of the distribution of the number of anti‐Xf comprised in each domain for the bacteria assay in sap, is as high as = 6.5 × 10¹⁰. LODs and LOQs in the saps’ assay are: LOD = 7 bacteria per mL and LOQ = 33 bacteria per mL. c) A comparison of the SiMoT and the qPCR dose curves was carried out on the same X. fastidiosa standard solutions in PBS in the 0–107 bacteria per mL range. Also in this case the data are relevant to three replicates and the errors are taken as one standard deviation. The values in the abscissa are: on the left the −ΔI/I 0 data of panel (a) normalized by the SiMoT response saturated value (−ΔI/I 0)max = 0.68; on the right, the qPCR values of the quantification cycle, C q, normalized by the highest number of cycles, C q max = 33.64 cycles, needed to assay the sample with the lowest concentration. The qPCR responses below 200 bacteria per mL (gray shaded area) are those categorized as undetermined samples, ascribed neither to the positive nor to the negative response. This marks the level of the background fluorescence plus nine times noise’ standard deviation (see Experimental Section) hence being the LOQ level. d) Modeling of the normalized SiMoT dose curve in PBS with the probability function[ 28 ] computes what is the probability that one bacterium, out of those present in the 0.1 volume, hits the 0.2 cm2 biofunctionalized electrode surface. See the Experimental Section for details.