
Figure 3.
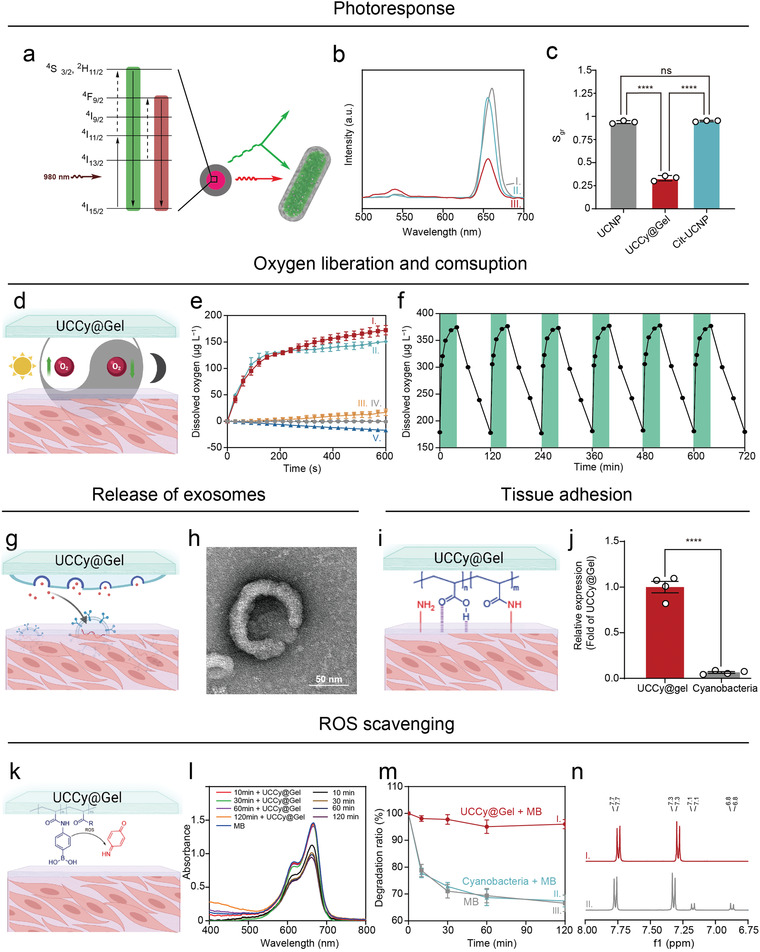
The functional characterization of UCCy@Gel. a) The possible energy conversion upon excitation of NIR light irradiation. b) The UCL spectra of I‐UCNPs, II‐Cit‐UCNPs, and III‐UCCy@Gel. c) The quantitative spectral purity analysis of upconversion red light. d) The schematic diagram of photosynthesis and respiration of UCCy@Gel. e) Time‐oxygen liberation curves of I‐UCCy@Gel + 980 nm NIR light irradiation, II‐UCCy@Gel + white light irradiation, III‐Cyanobacteria + 980 nm NIR light irradiation, IV‐PBS + 980 nm NIR light irradiation, and V‐UCCy@Gel in dark. f) The activity of UCCy@Gel (green = NIR on; white = dark treatment). g) The schematic diagram of exosomes from UCCy@Gel. h) TEM image of exosomes from UCCy@Gel. i) The schematic diagram of UCCy@Gel bonds tissues. j) The quantitative data of UCCy@Gel bonds tissues. k) The schematic diagram of ROS scavenging. l) The UV–vis spectra of MB under different conditions at different times. m) The MB degradation ratio of I‐UCCy@Gel + MB, II‐cyanobacteria + MB, III‐MB. n) 1H NMR spectra of I‐before oxidation, II‐after oxidation. *p < 0.05, **p < 0.01, ***p < 0.001, ****p < 0.0001. Data are means ± SD (n ≥ 3).