
Figure 7.
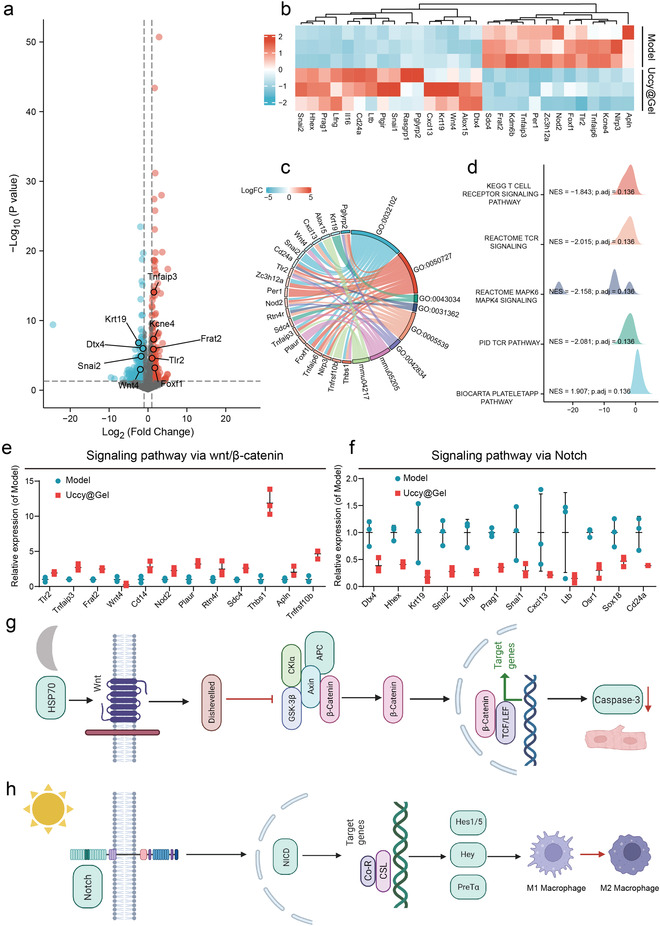
The UCCy@Gel mechanism of action. a) Volcano plot of differentially expressed genes determined by whole‐transcriptome RNA‐seq (gray: genes that are not significantly different; red: upregulated genes; blue: downregulated genes). b) Heatmap of differentially expressed genes. (red indicating relatively high expressed genes, blue indicating relatively low expressed genes). c) GO differential gene analysis. d) KEGG visual network data analysis. E,f) Analysis of differential gene expression of Wnt/β‐catenin and Notch pathway. g) The upregulation of HSP70 activated the Wnt/β‐catenin pathway and downregulates caspase‐3 in CMs after dark treatment. h) Activation of the Notch pathway suppressed M1 macrophages polarization after oxygen therapy. Data are means ± SEM (n ≥ 3).