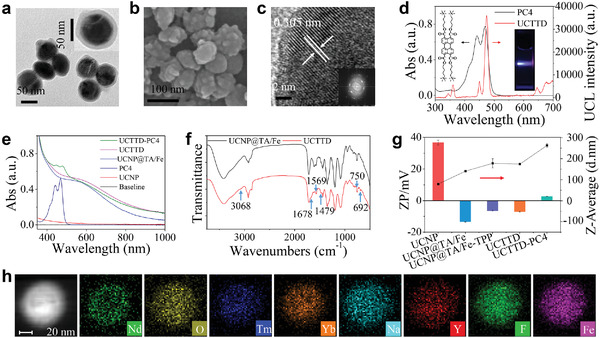
Figure 1.

Characterization of the nanoparticles. a) TEM image and b) SEM image of the UCTTD. c) STEM image of UCTTD and the fast Fourier transform (FFT) pattern (inset). d) UV–vis absorption spectrum of PC4 and fluorescence spectrum (Ex = 808 nm) of UCTTD. The inset presents UCL image of UCTTD in vitro. e) UV–vis spectra of UCNPs, PC4, UCNP@TA/Fe, UCTTD, and UCTTD‐PC4. f) FTIR spectra of UCNP@TA/Fe and UCTTD. The peaks at 3068, 1569, 1479, 750, and 692 cm−1 correspond to the benzene ring from the TPP, and peak at 1678 cm−1 corresponds to the carbonyl group (O=C—OH) from the cRGD. g) Hydrodynamic diameters (line graph) and zeta potentials (histogram) of UCNPs, UCNP@TA/Fe, UCNP@TA/Fe‐TPP, UCTTD, and UCTTD‐PC4. h) High‐angle annular dark field scanning transmission electron microscopy (HAADF‐STEM) and elemental mapping images of an individual UCTTD nanoparticle.
