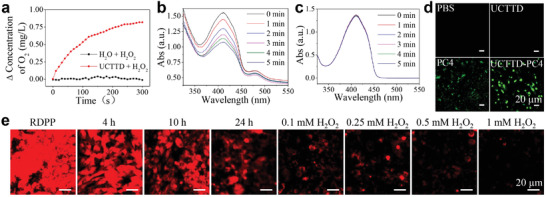
Figure 3.

a) Time‐dependent O2 generation through catalysis of H2O2 (0.25 mm) by UCTTD measured by a dissolved oxygen meter. The UV–vis absorption spectra of DPBF solution containing H2O2 (1 mm) b) with and c) without UCTTD‐PC4 (1000 µg mL−1) after irradiation with 808 nm at 0.3 W cm−2 for different times. d) Confocal fluorescence images of ROS generation in Capan‐1 cells under different treatments (PBS, UCTTD+L, PC4+L470, and UCTTD‐PC4+L; L: 808 nm laser). e) Confocal images of intracellular RDPP fluorescence variation indicating O2 content at different time points (0, 4, 10, and 24 h) or at 24 h in the presence of H2O2 (0.1, 0.25, 0.5 or 1 mm). Scale bar: 20 µm.
