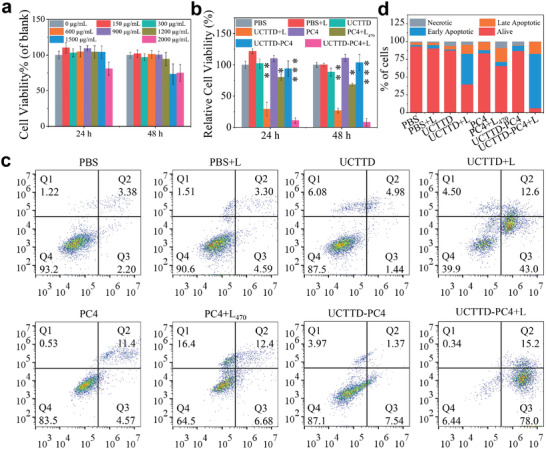
Figure 4.

Cell viability and apoptosis measurement after different treatments. a) Relative viabilities of Capan‐1 cells incubated with various concentrations of UCTTD for 24 or 48 h. b) Relative cell viabilities treated with various formulations for 24 or 48 h. c) Representative flow cytometry data of the Annexin V‐FITC and PI costained Capan‐1 cells after incubation with various formulations for 48 h. The number of cells collected in each group was 20 000. Q1, Q2, Q3, and Q4 represent necrotic, late apoptotic, early apoptotic, and living cells, respectively. d) Statistical analysis of cell apoptosis analysis from three independent experiments. Data are presented as means ± SD (standard deviation). L470 represents 470 nm laser at power density of 0.08 W cm−2, L represents 808 nm laser at power density of 0.3 W cm−2 (n = 3, *p < 0.05; **p < 0.01; ***p < 0.001).
