Figure 6.

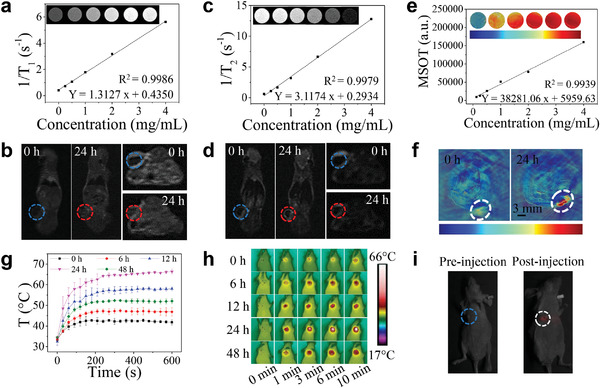
In vitro and in vivo four‐modal imaging. a) T 1‐ and c) T 2‐weighted MR images of UCTTD at different concentrations, and the corresponding longitudinal (r1) and transverse (r2) relaxation rates versus the concentration of UCTTD. b) and d) In vivo MR images of Capan‐1 tumor‐bearing BALB/c mice after the intravenous injection of UCTTD at 0 and 24 h, the blue and red dotted circles represent tumor areas at 0 and 24 h, respectively. e) In vitro PAI images of UCTTD at various concentrations and corresponding plot of the linear relationship between PAI intensity and the concentration. f) PAI images of tumor‐bearing BALB/c mice models after intravenously administered with UCTTD at 0 and 24 h (white dotted circles). h) In vivo infrared thermal images taken at various time points (0, 6, 12, 24, and 48 h) postinjection of UCTTD acquired under 808 nm laser irradiation at power density of 1.2 W cm−2 and g) the corresponding tumor temperature curves. i) In vivo UCL images of tumors before (blue dotted circle) and after (white dotted circle) injection of UCTTD.
