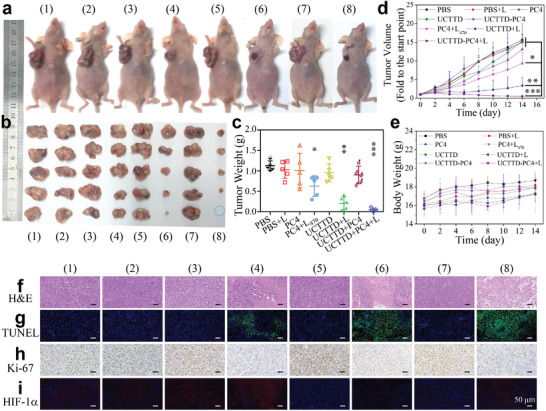
Figure 7.

Study on therapeutic effects in vivo. a) Photographs of representative Capan‐1 tumor‐bearing female BALB/c‐nu mice and b) dissected tumors of groups at day 14 after the different treatments. (The blue dotted circle indicates that the tumor has been cured.) c) Tumor weights of mice from different treatment groups on day 14. d) The relative tumor volume and e) mean body weight change curves of mice from different groups during the monitoring period. f) H&E staining images and g) immune‐staining images (TUNEL; h), Ki‐67; i), HIF‐1α) of tumor sections from different groups after 14 days of treatment. L470 represents 470 nm laser at power density of 0.08 W cm−2 for 10 min, L represents 808 nm laser at power density of 1.2 W cm−2 for 10 min (n = 5, *p < 0.05; **p < 0.01; ***p < 0.001). (1) to (8) represent PBS, PBS+L, PC4, PC4+L470, UCTTD, UCTTD+L, UCTTD‐PC4, and UCTTD‐PC4+L, respectively. All scale bars are 50 µm.
