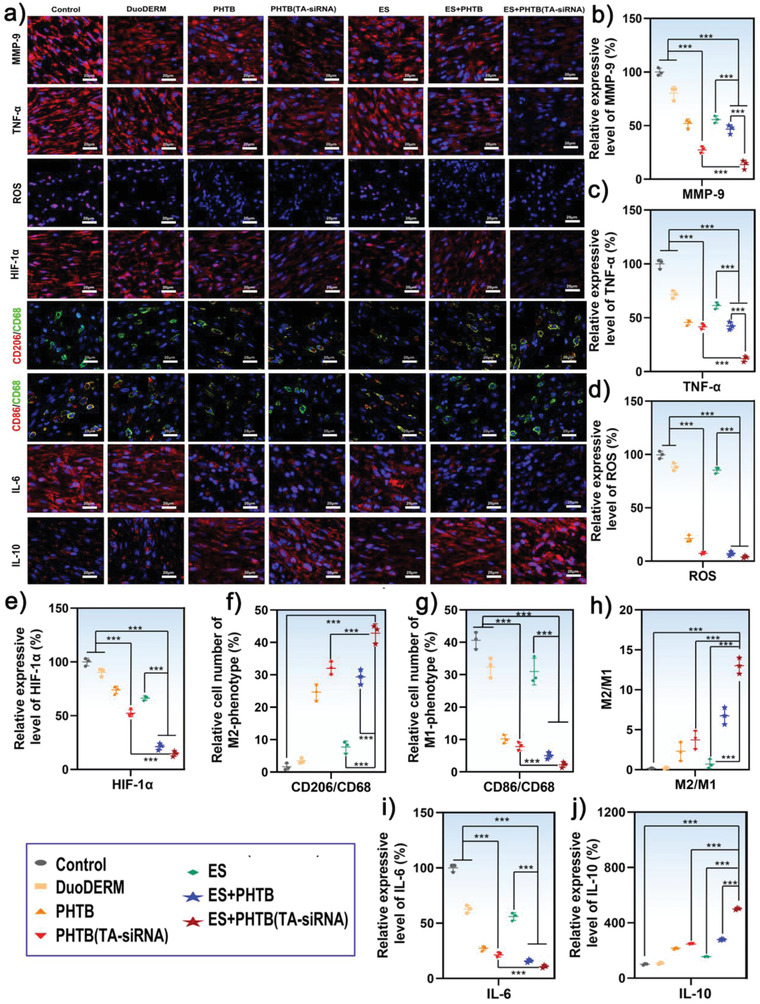
Figure 8.

a) The immunofluorescent staining of the MMP‐9, TNF‐α, HIF‐1α, IL‐10, and IL‐6 expressed in diabetic chronic wounds and the labeling of the ROS and macrophage phenotypic markers produced in the skin tissues. The blue color represents DAPI‐stained cell nucleus. The ROS was labeled with a DHE fluorescent probe (violet color). Immunofluorescence double staining of CD68‐labeled (green) macrophages, and CD206‐labeled (red) M2‐type macrophages. Immunofluorescence double staining of CD68‐labeled (green) macrophages, and CD86‐labeled (red) M1‐type macrophages. The analyses were performed on day 7, and the scale bar represents a 20 µm scale. The quantitative analyses for the intensities of the fluorescent signals produced by b) MMP‐9, c) TNF‐α, d) ROS, e) HIF‐1α. The intensities of the fluorescent signals in diabetic chronic wounds in the control groups were set to 100% (**: p < 0.01, ***: p < 0.001, n = 3).f) The population of double‐positive M1 macrophages and g) that of double‐positive M2 macrophages (***: p < 0.001, n = 3). h) The population ratios of M2 macrophages to M1 macrophages (***: p < 0.001, n = 3). The quantitative analyses for the intensities of the fluorescent signals produced by i) IL‐6, and j) IL‐10. (***: p < 0.001, n = 3).
