
Figure 5.
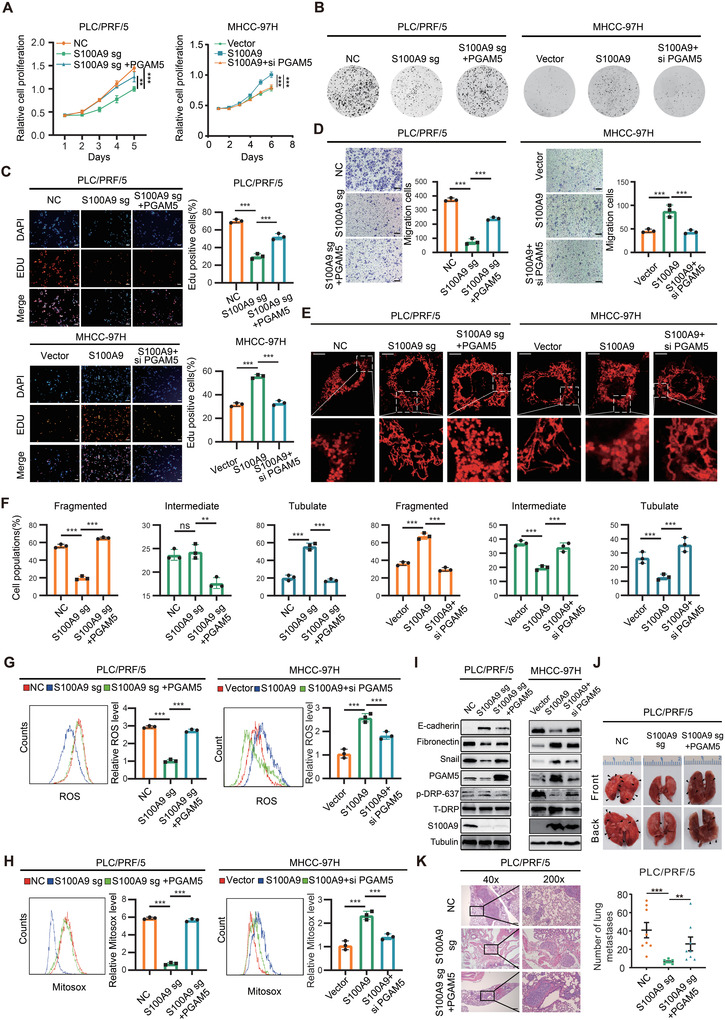
S100A9 affects HCC growth and metastasis through a PGAM5‐dependent pathway. A–C) Ectopic expression of PGAM5 enhanced S100A9 knockout‐induced cell growth arrest, while knockdown of PGAM5 attenuated S100A9‐induced cell growth, as indicated by CCK‐8 assay (A), clone formation assay (B), and EdU assay (C). Scale bars = 100 µm. D) Ectopic expression of PGAM5 enhanced S100A9 knockout‐induced cell migration, while knockdown of PGAM5 attenuated S100A9‐induced cell migration, as indicated by Transwell assay. Scale bars = 100 µm. Data in (A)–(D) are presented as mean ± SEM, n = 3. **p < 0.01, ***p < 0.001 by two‐tailed unpaired Student t‐test. E,F) Ectopic expression of PGAM5 reversed S100A9‐sg‐induced mitochondrial fusion and promoted mitochondrial fission, while knockdown of PGAM5 inhibited S100A9‐induced mitochondrial fission. Scale bars = 5 µm. The proportion of HCC cells (n = 100 cells for each sample, repeated three times) with tubulated, intermediate, and fragmented mitochondria was quantified. Data are presented as mean ± SEM, **p < 0.01, ***p < 0.001 by two‐tailed unpaired Student t‐test. G,H) Ectopic expression of PGAM5 enhanced the intracellular ROS level of S100A9‐sg cells, while knockdown of PGAM5 attenuated S100A9‐induced intracellular ROS (G) and intramitochondrial ROS (H), as indicated by DCFH‐DA and MitoSOX fluorescence assays (n = 3). I) Western blot analysis showing the expression of S100A9, EMT marker, and PGAM5 target genes in HCC cells. J,K) Ectopic expression of PGAM5 promoted the lung metastatic capacity of HCC cells (n = 8). Scale bars = 100 µm. Data in (G), (H), and (K) are presented as mean ± SEM, **p < 0.01, *** p < 0.001 by two‐tailed unpaired Student t‐test.