
Figure 2.
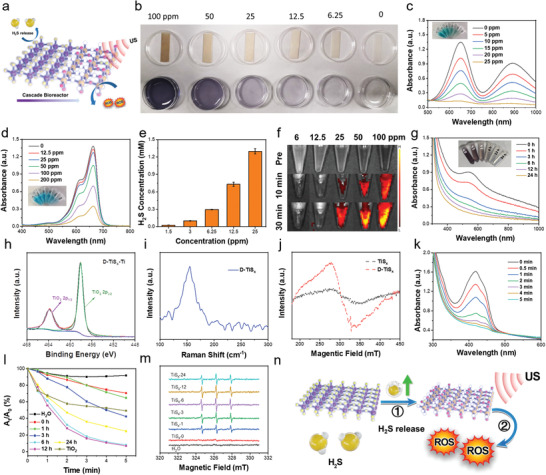
H2S release and sonodynamic performance of PEG–TiS X NSs. a) Schematic illustration of H2S release and sonodynamic properties of PEG–TiS X NSs. b–d) H2S release performance of PEG–TiS X NSs with different concentrations using b) lead acetate test paper, c) TMB, and d) MB as the indicators, respectively. e) H2S release property of PEG–TiS X NSs with different concentrations using WSP‐1 probe. f) The fluorescence imaging of PEG–TiS X NSs with different concentrations using H2S probe at different time points. g) UV–vis–NIR spectra of PEG–TiS X NSs with different degradation times. h) XPS spectrum of Ti 2p of D‐TiS X NSs. i) Raman spectrum of D‐TiS X NSs. j) ESR spectra demonstrating the sulfur vacancies of TiS X and D‐TiS X NSs. k) ROS generation ability of PEG–TiS X NSs after degradation for 12 h. l) Comparison of sonodynamic performance of PEG–TiS X NSs with different degradation times and commercial TiO2. m) ESR spectra exhibiting 1O2 generation by H2O and PEG–TiS X NSs with different degradation times under US irradiation. n) The schematic mechanism of TiS X NSs for sonodynamic property.