
Figure 5.
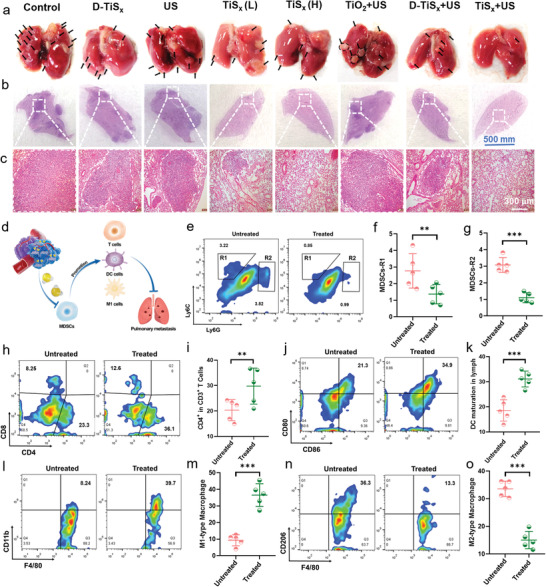
The immunoreaction regulation effect of H2S. a–c) Images of lung metastases in different groups by a) digital photography and b,c) the corresponding H&E staining of lung tissues on the 35th day. d) Schematic illustration of H2S‐regulated immunoreaction. e–i) Flow cytometry plots and related quantification of e–g) MDSCs and h,i) CD4+ T cells in tumors treated with PEG–TiS X NSs. j) Flow cytometry plots and k) related quantification of mature DCs in lymph. l–o) Flow cytometry plots and related quantification of l,m) M1 cells and n,o) M2 cells in tumors treated with PEG–TiS X NSs. Data are presented as mean values ± SD (n = 5 biologically independent mice).