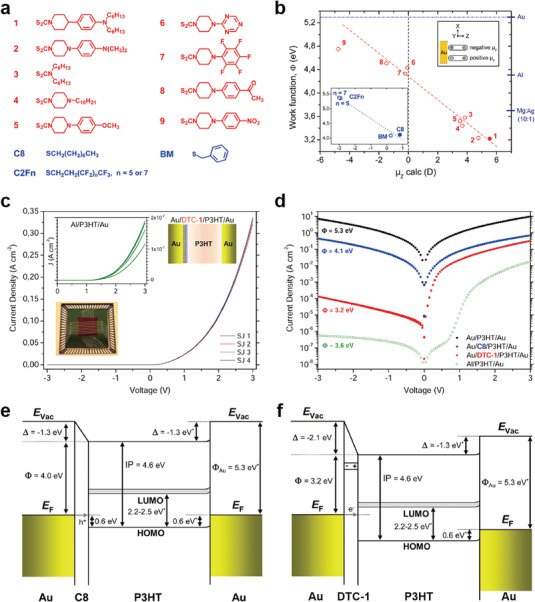
Figure 2.

a) Molecular structures of the investigated DTC (red) and thiolate (blue) derivatives. b) Dependence of the work function Φ (from UV photoelectron spectroscopy (UPS) measurements) on the dipole moment µ z (from density functional theory calculations) for the nine DTC derivatives investigated in this study. The inset shows the graph for thiolate monolayers. As a reference, relevant values of Φ for commonly used metals and alloys are shown on the right ordinate. c) Diode characteristics in junctions implementing the Au/DTC‐1/P3HT/Au structure (the layer structure is shown in the upper right inset). In the left inset, J–V characteristics from the Al/P3HT/Au structure are presented for comparison. The standard deviation of J (at +3 V) from the mean is 2% for Au/DTC‐1/P3HT/Au junctions and 2% for Al/P3HT/Au junctions. The lower inset shows the crossbar structure mounted on a chip carrier. d) Semilog plot showing the averaged J–V curves for Au/SAM/P3HT/Au and Al/P3HT/Au junctions, as well as for Au/P3HT/Au reference junctions (black data points). Energy band diagram illustrating the band alignment in e) Au/C8/P3HT/Au and f) Au/DTC‐1/P3HT/Au junctions, as obtained from UPS measurements. Reproduced with permission.[ 90 ] Copyright 2014, American Chemical Society.
