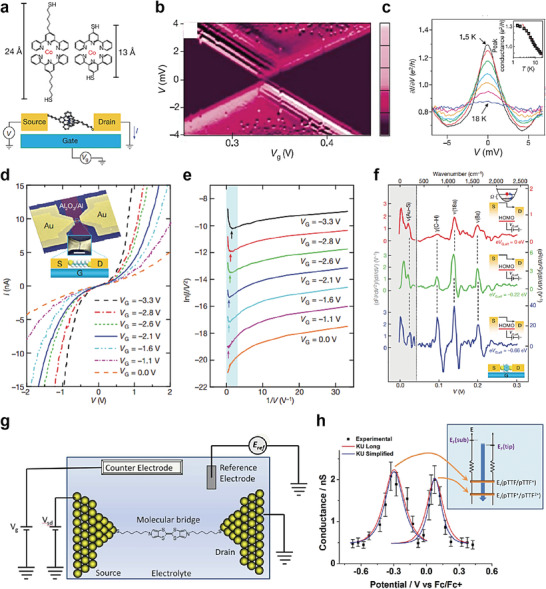
Figure 15.

a) Molecular structures of the Co complexes and schematic diagram of the single‐molecule transistors. b) Coulomb blockade observed in devices formed from longer molecules. c) Kondo peaks as a function of voltage. The inset depicts the conductance as a function of the temperature at V = 0. Reproduced with permission.[ 74 ] Copyright 2002, Nature Publishing Group. d) Representative I−V curves measured at 4.2 K for different values of V G. Inset, the device structure and schematic: S, source; D, drain; G, gate. Scale bar: 100 nm. e) Fowler–Nordheim plots corresponding to the I−V curves in (d), showing the transition from direct to Fowler–Nordheim tunneling with a clear gate dependence. The plots are offset vertically for clarity. The arrows indicate the boundaries between transport regimes (corresponding to V trans). f) IET spectra measured at 4.2 K for different values of eV G,eff, with vibration modes assigned. The left‐hand y‐axis corresponds to the grey shaded region of the spectra, and the various right‐hand y‐axes (with different scales) correspond to the related (color‐coded) spectra in the non‐shaded region. The vertical dotted line corresponds to V = 45 mV (363 cm−1). Significant modification in the spectral intensity and line shape for the benzene ring modes, γ(C—H), ν(18a), and ν(8a), was observed for different values of eV G,eff, as indicated. Insets, energy diagrams illustrating inelastic tunneling as the position of the HOMO resonance shifts through gating. Reproduced with permission.[ 55 ] Copyright 2009, Nature Publishing Group. g) Schematic illustration of the electrochemical gating in a single molecule in an electrolyte. h) Conductance−sample potential relationship of pTTF. The red lines depict the long KU model, and the blue lines depict the simplified KU model. For both redox transitions, the KU model versions fit the experimental data well. The inset depicts a schematic energy level representation of the KU model for the two redox transitions. When the electrode potential is scanned positive, the pTTF/pTTF+ redox transition is first brought into “resonance.” At increasingly positive potentials, the second redox transition (pTTF2+/pTTF+) comes into resonance. Reproduced with permission.[ 56 ] Copyright 2012, American Chemical Society.
