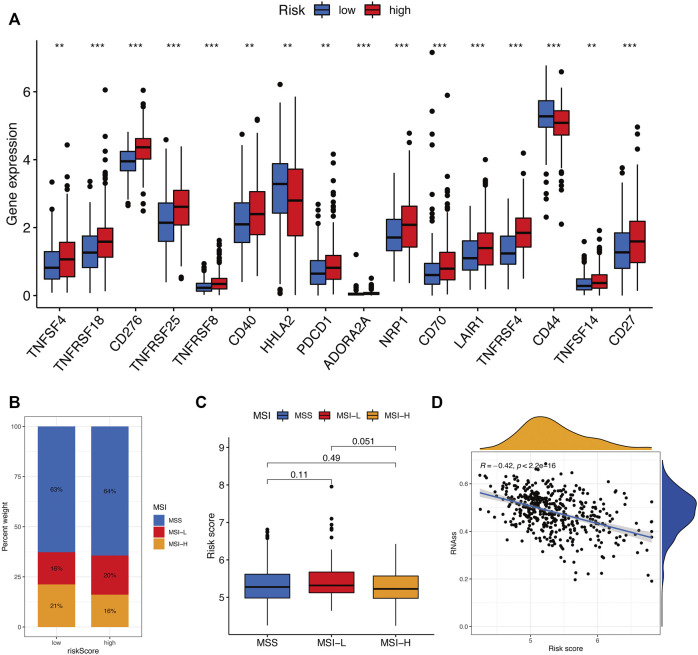
FIGURE 10.
Evaluation of the immunotherapy response between two risk groups. (A) Immune checkpoint expression levels between the high- and low-risk groups. (B and C) Correlation between risk score and MSI. (D) Correlation between risk score along with CSC index. ns, p > 0.05. ns, not significant; *, p < 0.05; **, p < 0.01; ***, p < 0.001.

