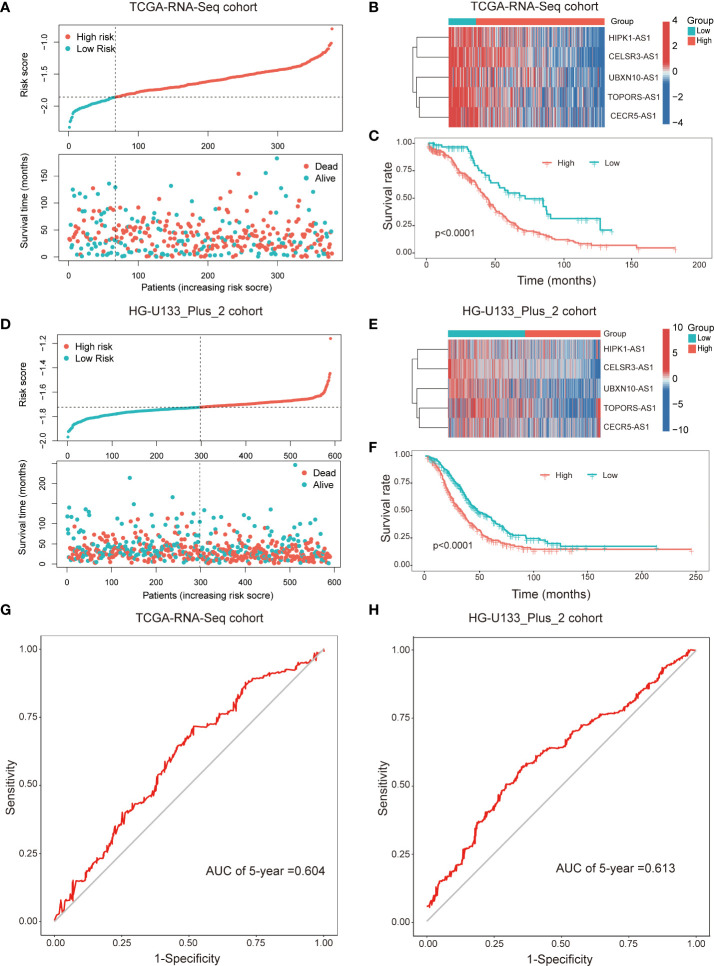
Figure 3.
The immune-related prognostic signature was established and validated in TCGA-RNA-Seq cohort and HG-U133_Plus_2 cohort, respectively. Distributions of risk scores and survival status of OC patients in the TCGA-RNA-Seq cohort (A) and HG-U133_Plus_2 cohort (D); Heat map analysis showed the association between risk score and the expression of the five lncRNAs in TCGA-RNA-Seq cohort (B) and HG-U133_Plus_2 cohort (E); Kaplan–Meier curves showed that the high-risk subgroup had worse OS than the low-risk subgroup in TCGA-RNA-Seq cohort (C) and HG-U133_Plus_2 cohort (F). ROC curves of the immune-related lncRNAs for predicting 5-year survival in TCGA-RNA-Seq cohort (G) and HG-U133_Plus_2 cohort (H).

