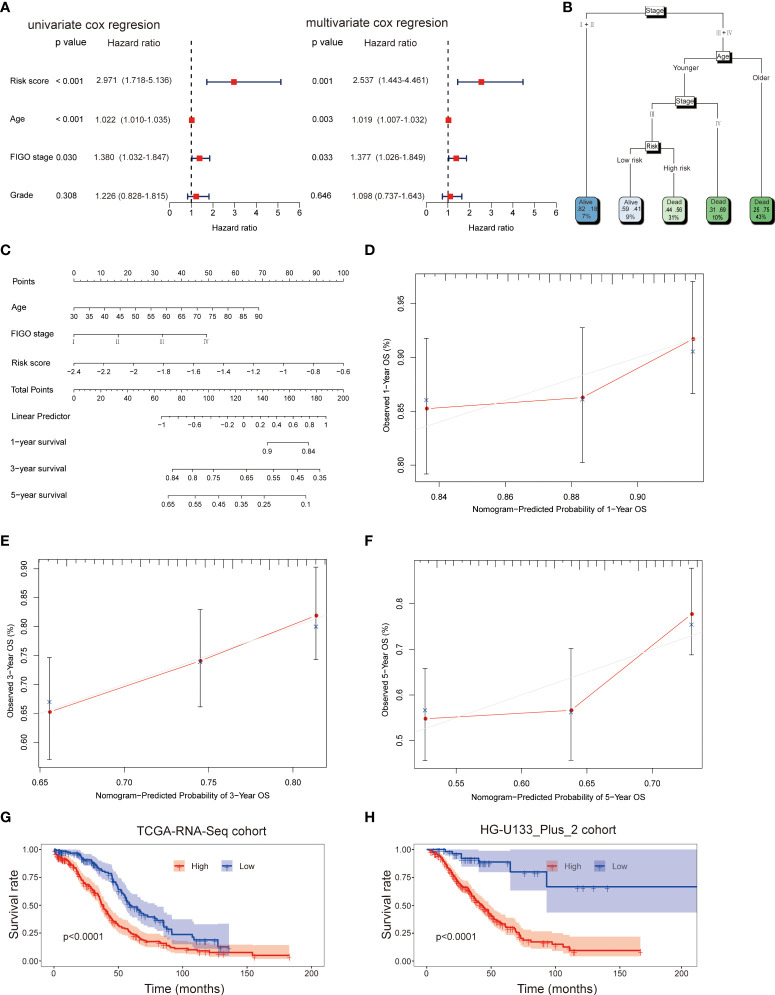
Figure 5.
Univariate and multivariate analyses revealed that risk score was an independent prognostic predictor in the TCGA-RNA-Seq cohort (A). Construction of decision tree based on risk score, age and stage. The younger and older subgroup were divided based on the median value of age (B). Construction of nomogram based on risk score, age and stage (C). Calibration plots of the nomogram for predicting the probability of OS at 1, 3, and 5-years in the TCGA-RNA-Seq cohort (D–F); KM survival plot analysis showed that patients with high-risk had a worse OS than patients with low-risk subgroup in both TCGA-RNA-Seq cohort and HG-U133_Plus_2 cohort (G, H).

