Figure 6.
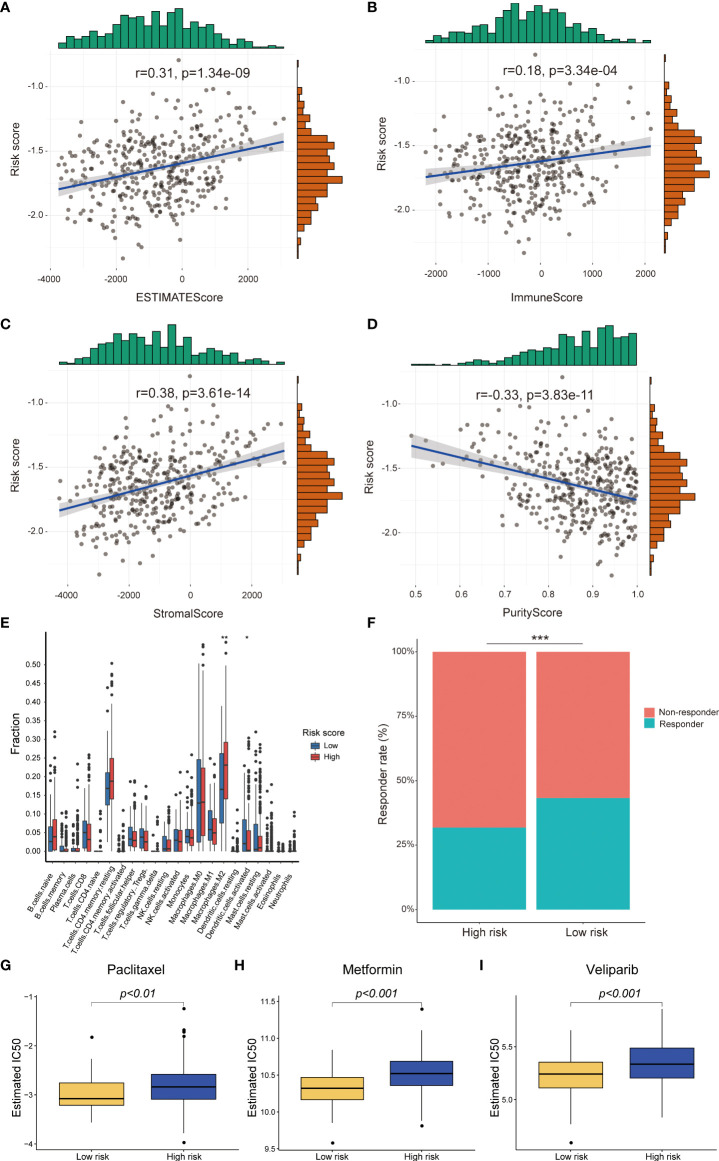
Difference between high-risk score group and low-risk score group in immune infiltration, immunotherapy and chemotherapy response prediction in TCGA-RNA-Seq cohort. The risk score was positively correlated with EstimateScore, ImmuneScore, StromalScore and negatively correlated with PurityScore (A-D); The different infiltrated fraction of 22 immune cells between high-risk group and low-risk group (E); The immunotherapy response of patients with OC in high- and low-risk subgroups (F); Estimated IC50 values indicated the chemotherapy response of paclitaxel, metformin and veliparib in TCGA-RNA-Seq cohort (G-I). *p < 0.05; **p < 0.01; ***p < 0.001.

