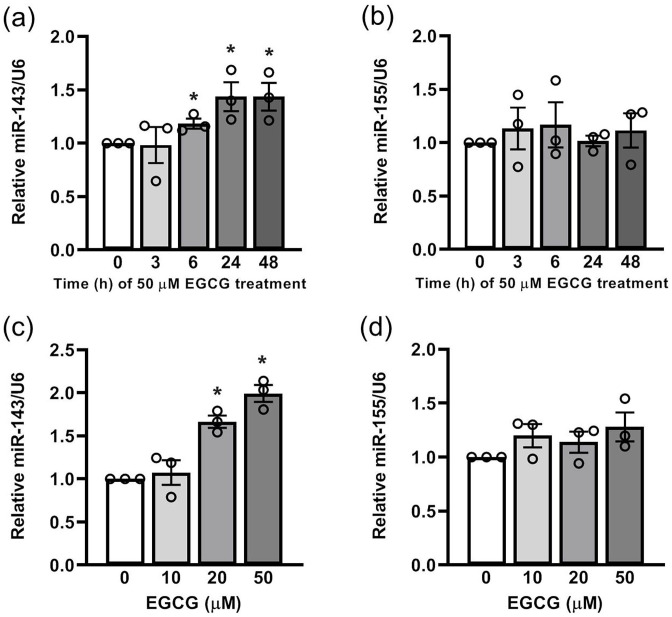
Figure 1.
The effect of EGCG on the levels of miR-143, but not miR-155 in 3T3-L1 cells: For dose-dependent effect, the cells were treated with EGCG for 24 h. (a) and (c) miR-143 expression was analyzed via quantitative PCR (qPCR). (b) and (d) miR-155 expression was analyzed by qPCR. Data are presented as mean ± SEM (n = 3). *P < 0.05, compared with the control group.

