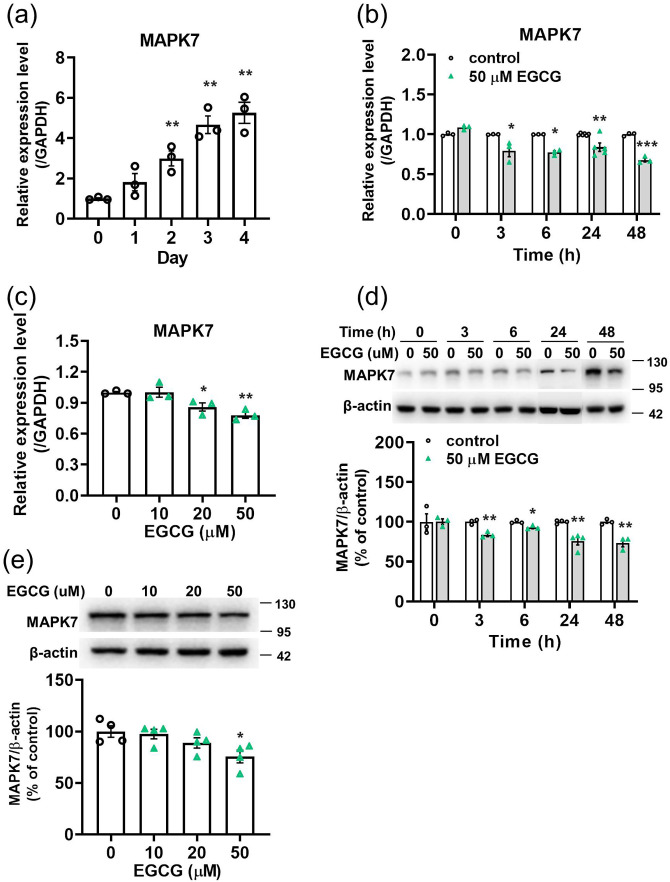
Figure 2.
The effect of EGCG on the mRNA and protein levels of MAPK7 in 3T3-L1 preadipocytes. For dose-dependent effect, the cells were treated with EGCG for 24 h. (a), (b), and (c) MAPK7 expression was analyzed via qPCR. (d) and (e) Representative immunoblotting analyses of MAPK7 and quantification of western blot bands. Data are presented as mean ± SEM (n = 3 or 4). *P < 0.05, **P < 0.01, ***P < 0.001, compared with the control group. (A color version of this figure is available in the online journal.)

