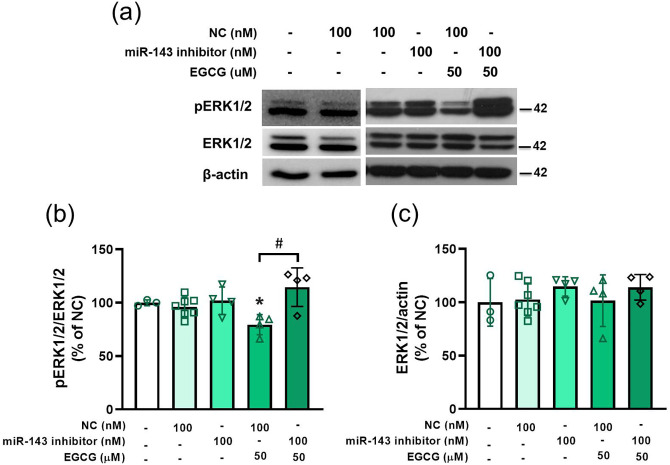
Figure 5.
Knockdown of miR-143 antagonizing EGCG-regulated pERK1/2 in 3T3-L1 preadipocytes. The cells are pretreated with miR-143 inhibitor or NC for 24 h, followed by 50 μM EGCG treatment for 48 h. (a) Representative immunoblotting analyses of pERK1/2 and ERK1/2. (b) and (c) Quantification of western blot bands. Data are presented as mean ± SEM (n = 3–7). *P < 0.05, compared with NC group. #P < 0.05, EGCG + NC versus EGCG + miR-143 inhibitor. (A color version of this figure is available in the online journal.)

