Figure 2.

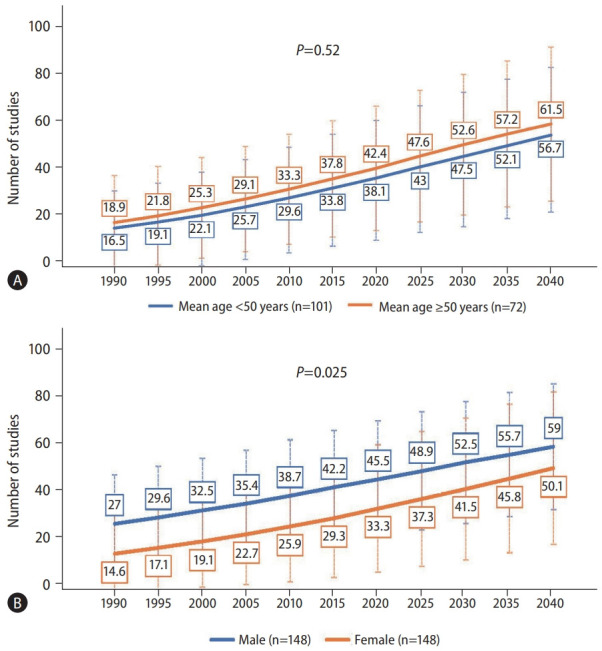
Forecast of nonalcoholic fatty liver disease prevalence by (A) age and (B) sex. P-values compare the rate of increase between subgroups via linear regression.

Forecast of nonalcoholic fatty liver disease prevalence by (A) age and (B) sex. P-values compare the rate of increase between subgroups via linear regression.